See What's Actually Happening
in Your Engineering Org
Stop guessing. Start knowing. Get visibility into where engineering time goes, who's bottlenecked, and what's at risk — using only Git metadata.
5 minutes to connect. Instant insights. No credit card required.
Blind to Where Engineering Time Goes?
Leaders can't explain why features take so long to ship. Is it coding? Reviews? Waiting? Without visibility, it's impossible to improve.
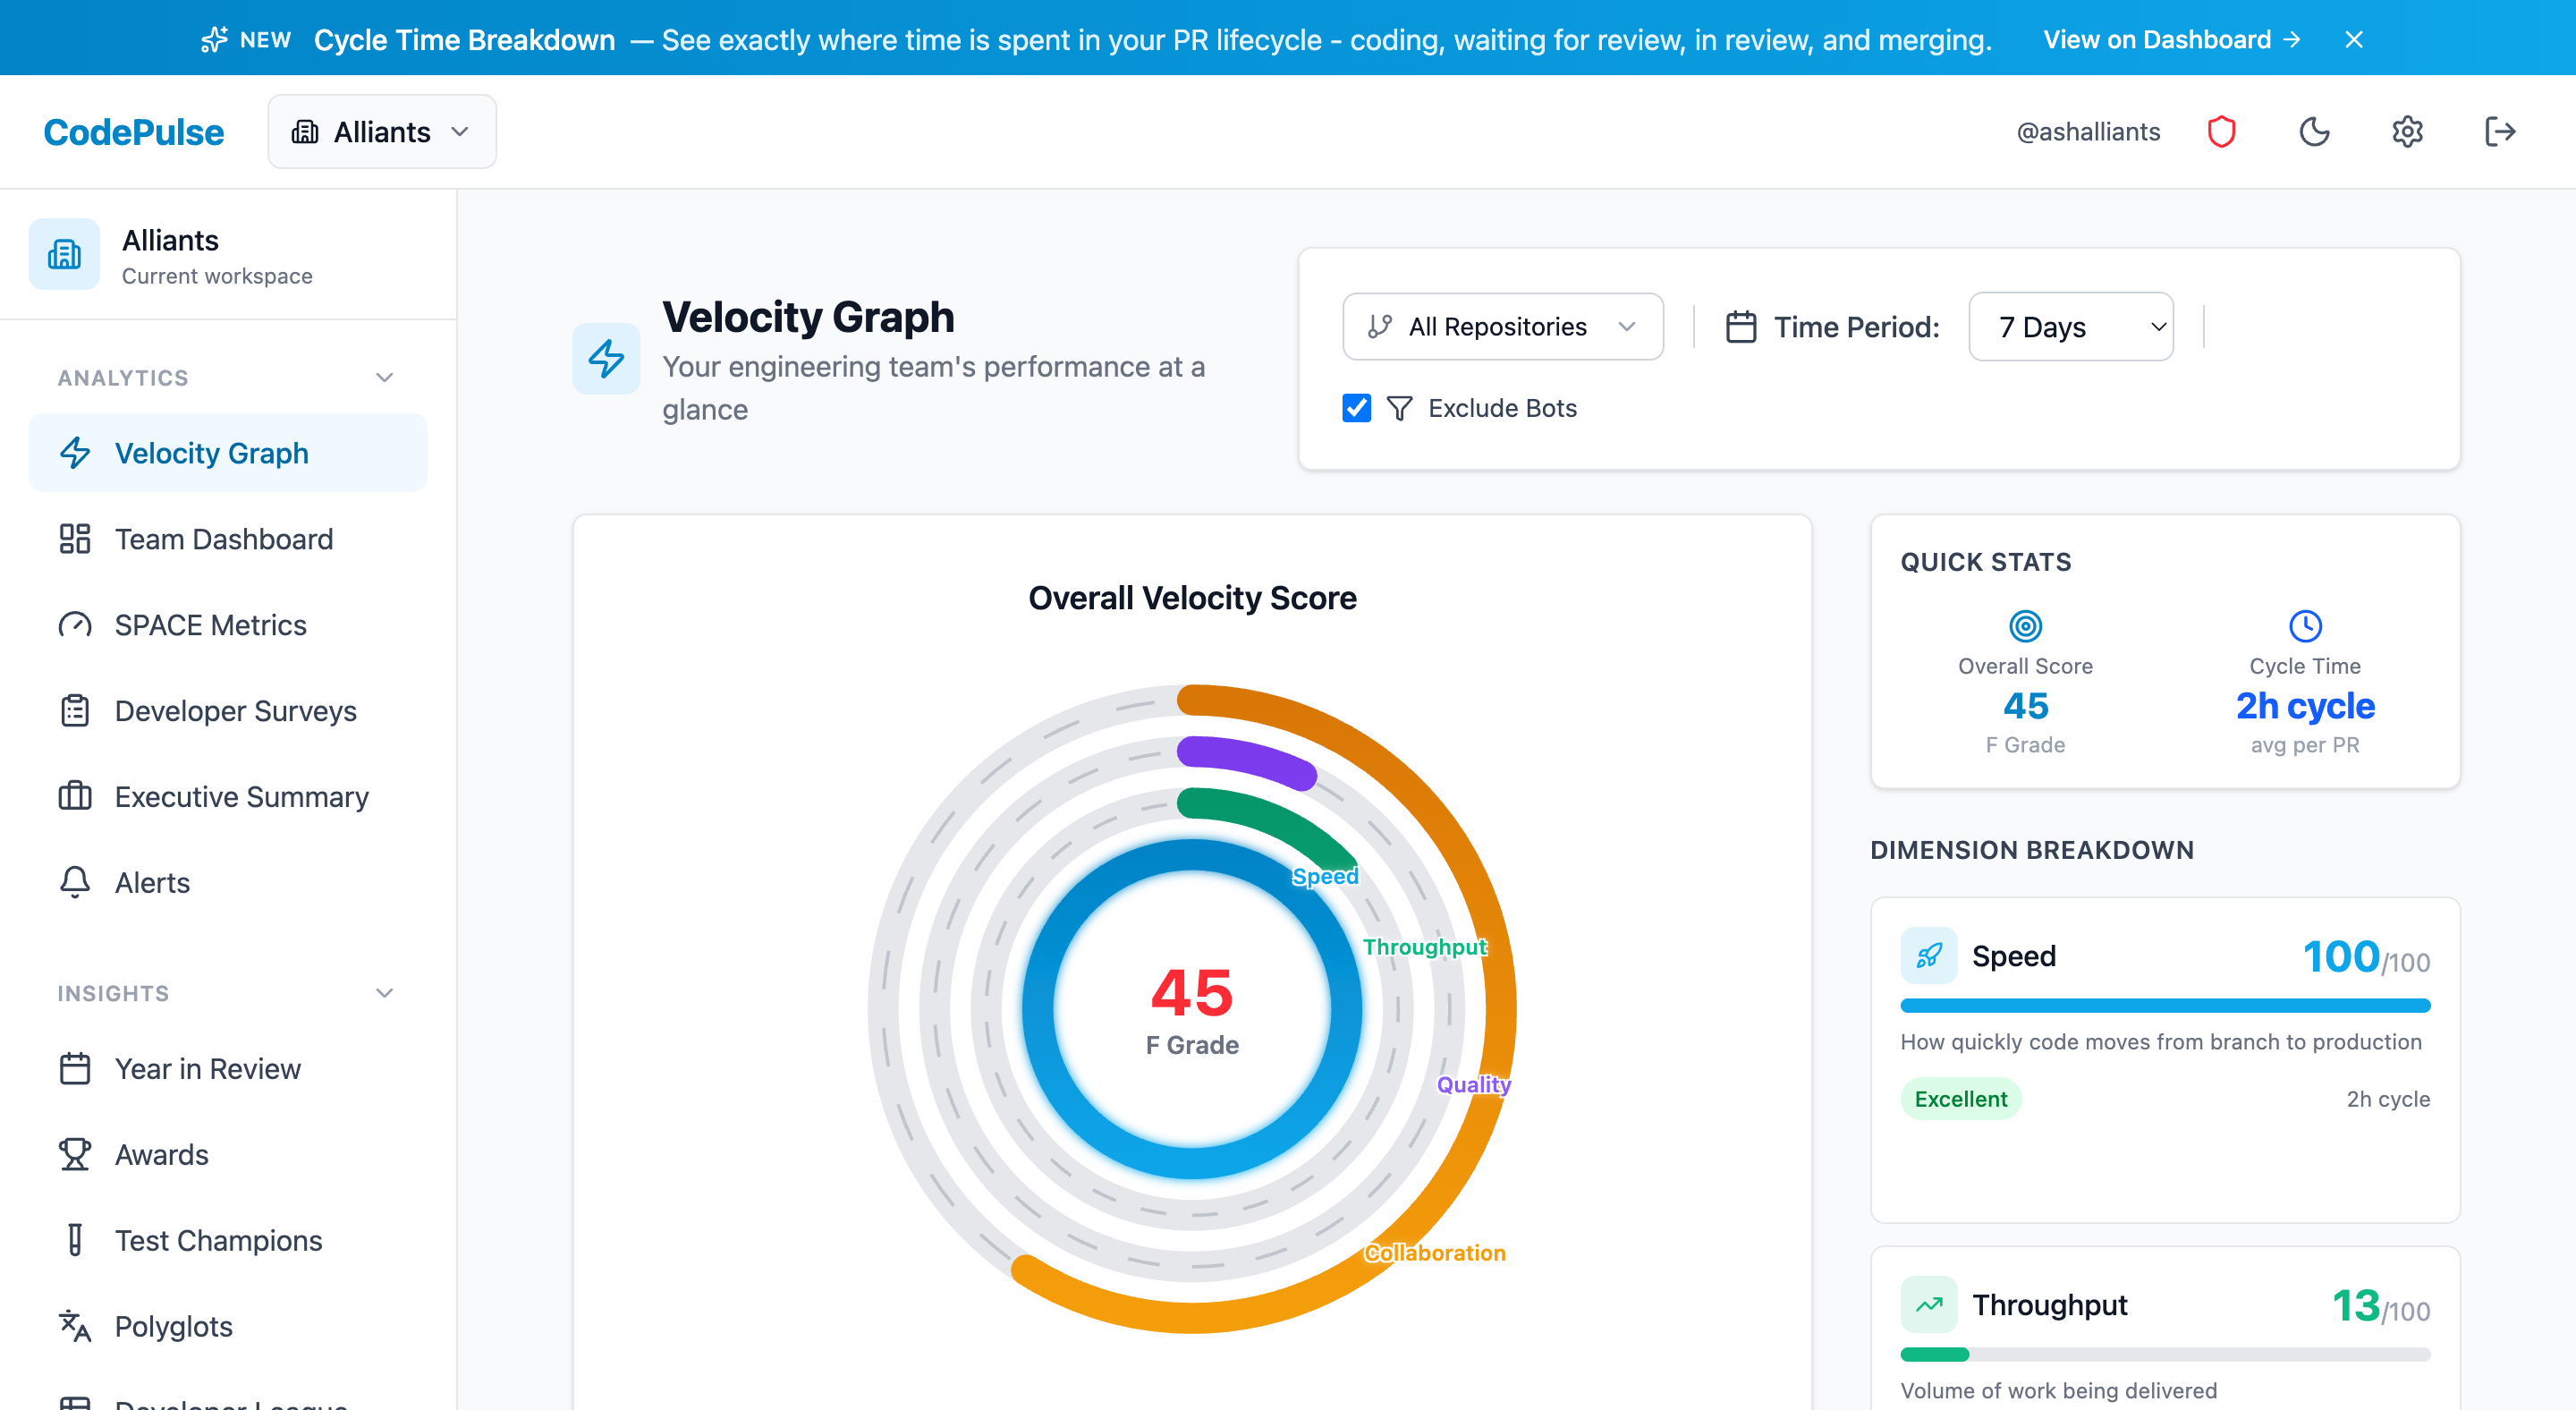
Cycle Time Breakdown
- •See exactly where time goes: coding, review, and waiting periods
- •Identify bottlenecks slowing down your delivery pipeline
- •Track trends over time to measure improvement
- •DORA metrics benchmarked against industry standards
Review Bottlenecks Slowing You Down?
PRs sit for days waiting for reviews. The same 2-3 people review everything while others barely participate. Knowledge stays siloed.
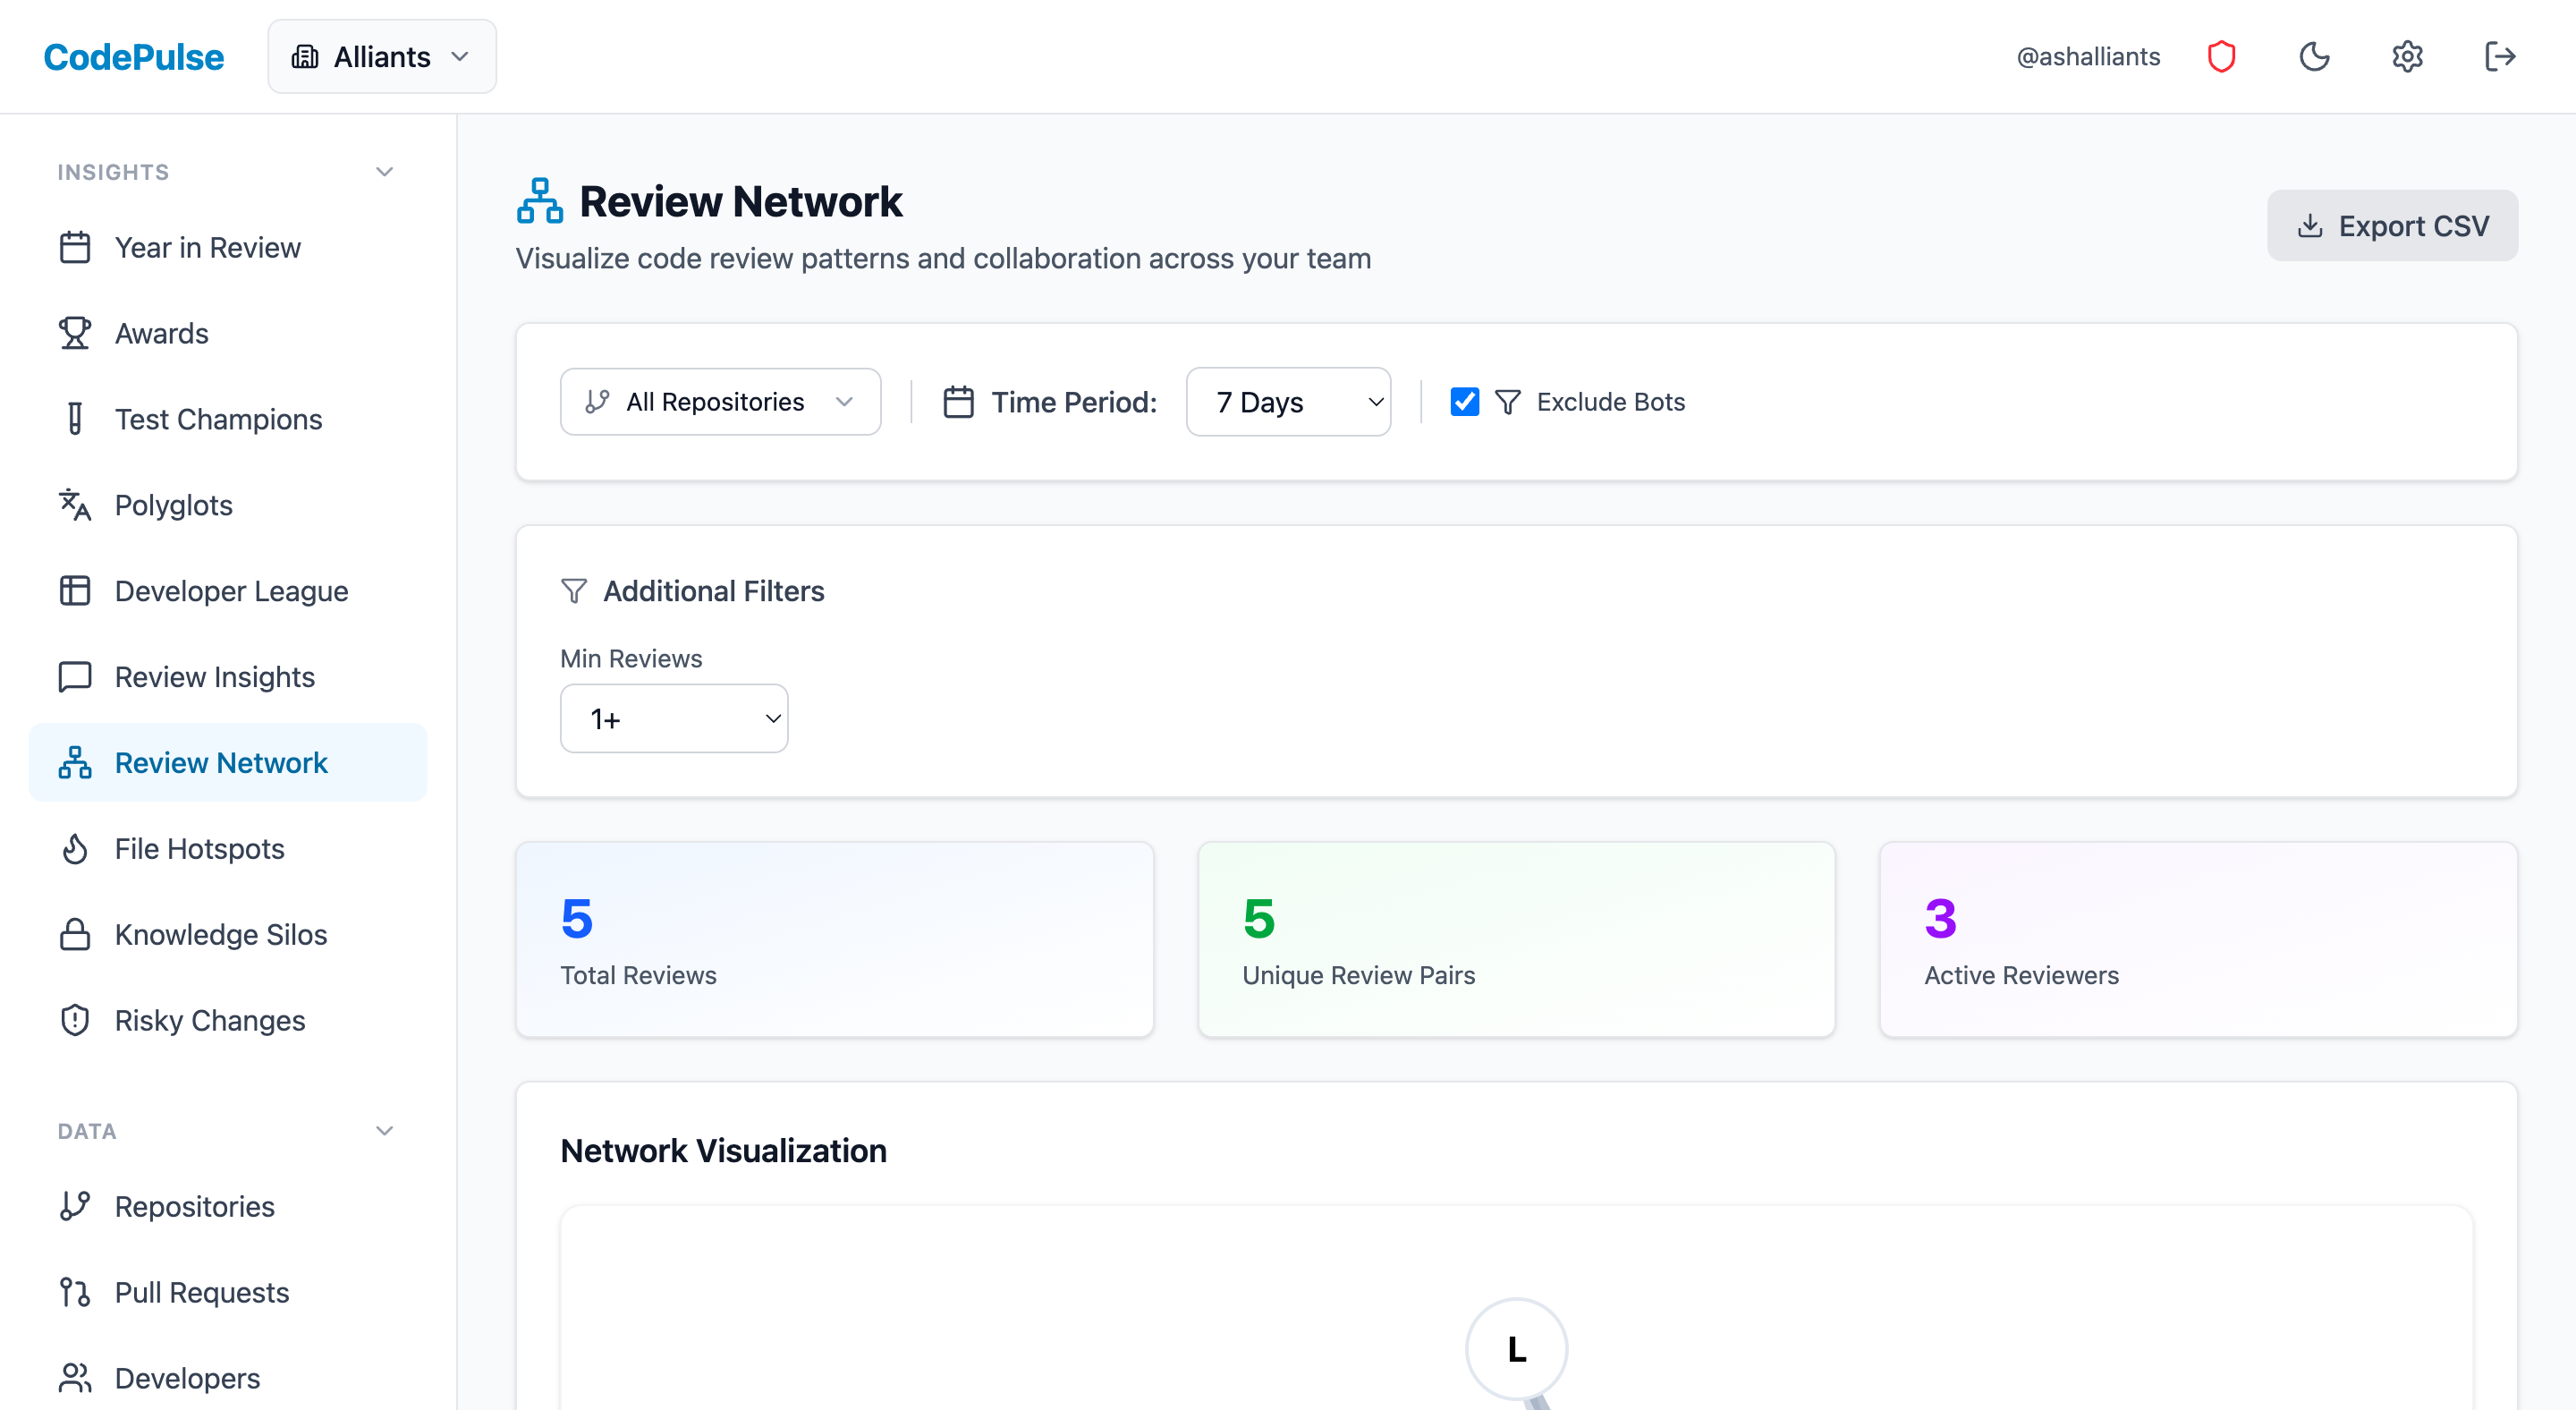
Review Network Visualization
- •See who reviews whose code with interactive network graphs
- •Identify review bottlenecks and imbalanced workloads
- •Spot isolated team members who need more engagement
- •Balance review load across the team fairly
Knowledge Silos Creating Risk?
Critical code is owned by one person. If they leave or get sick, nobody knows how it works. Bus factor of 1 is a business risk.
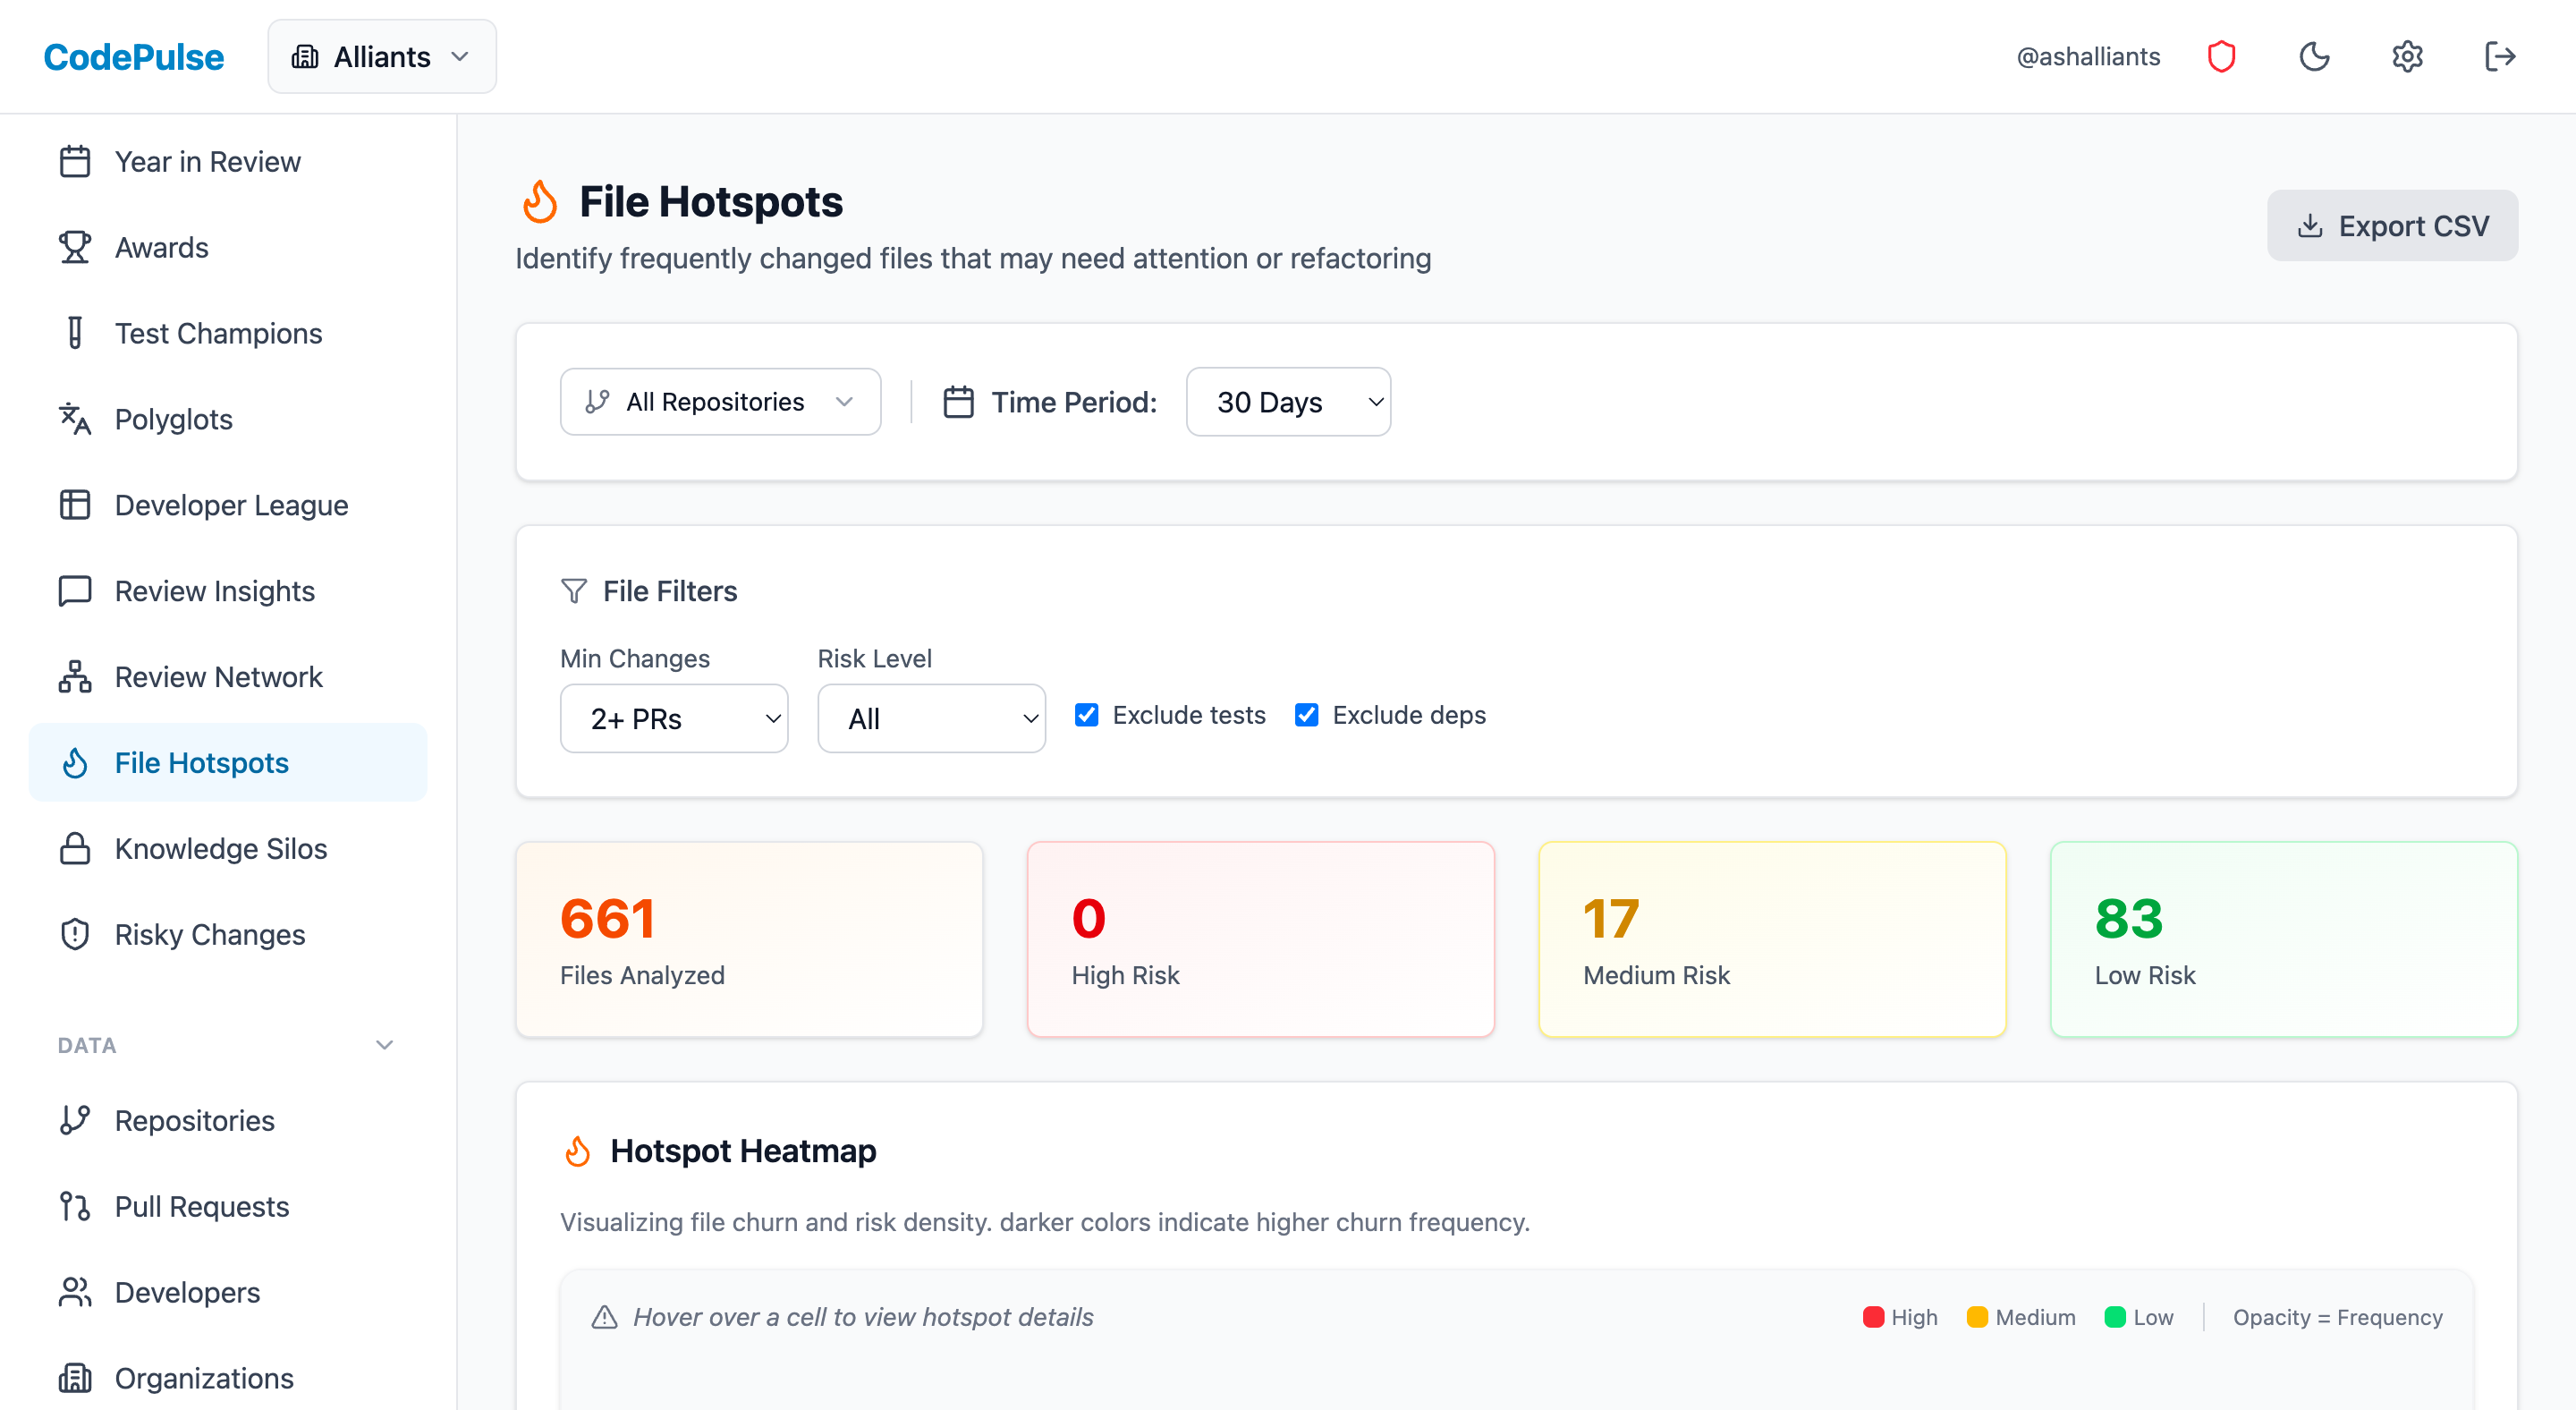
File Hotspots & Knowledge Silo Detection
- •Identify high-churn files that need attention
- •Spot single-contributor code before it becomes a problem
- •See which areas have healthy knowledge distribution
- •Prioritize cross-training and documentation efforts
Need Board-Ready Metrics?
Every leadership meeting, you're scrambling to gather data. Explaining engineering performance to non-technical stakeholders is exhausting.
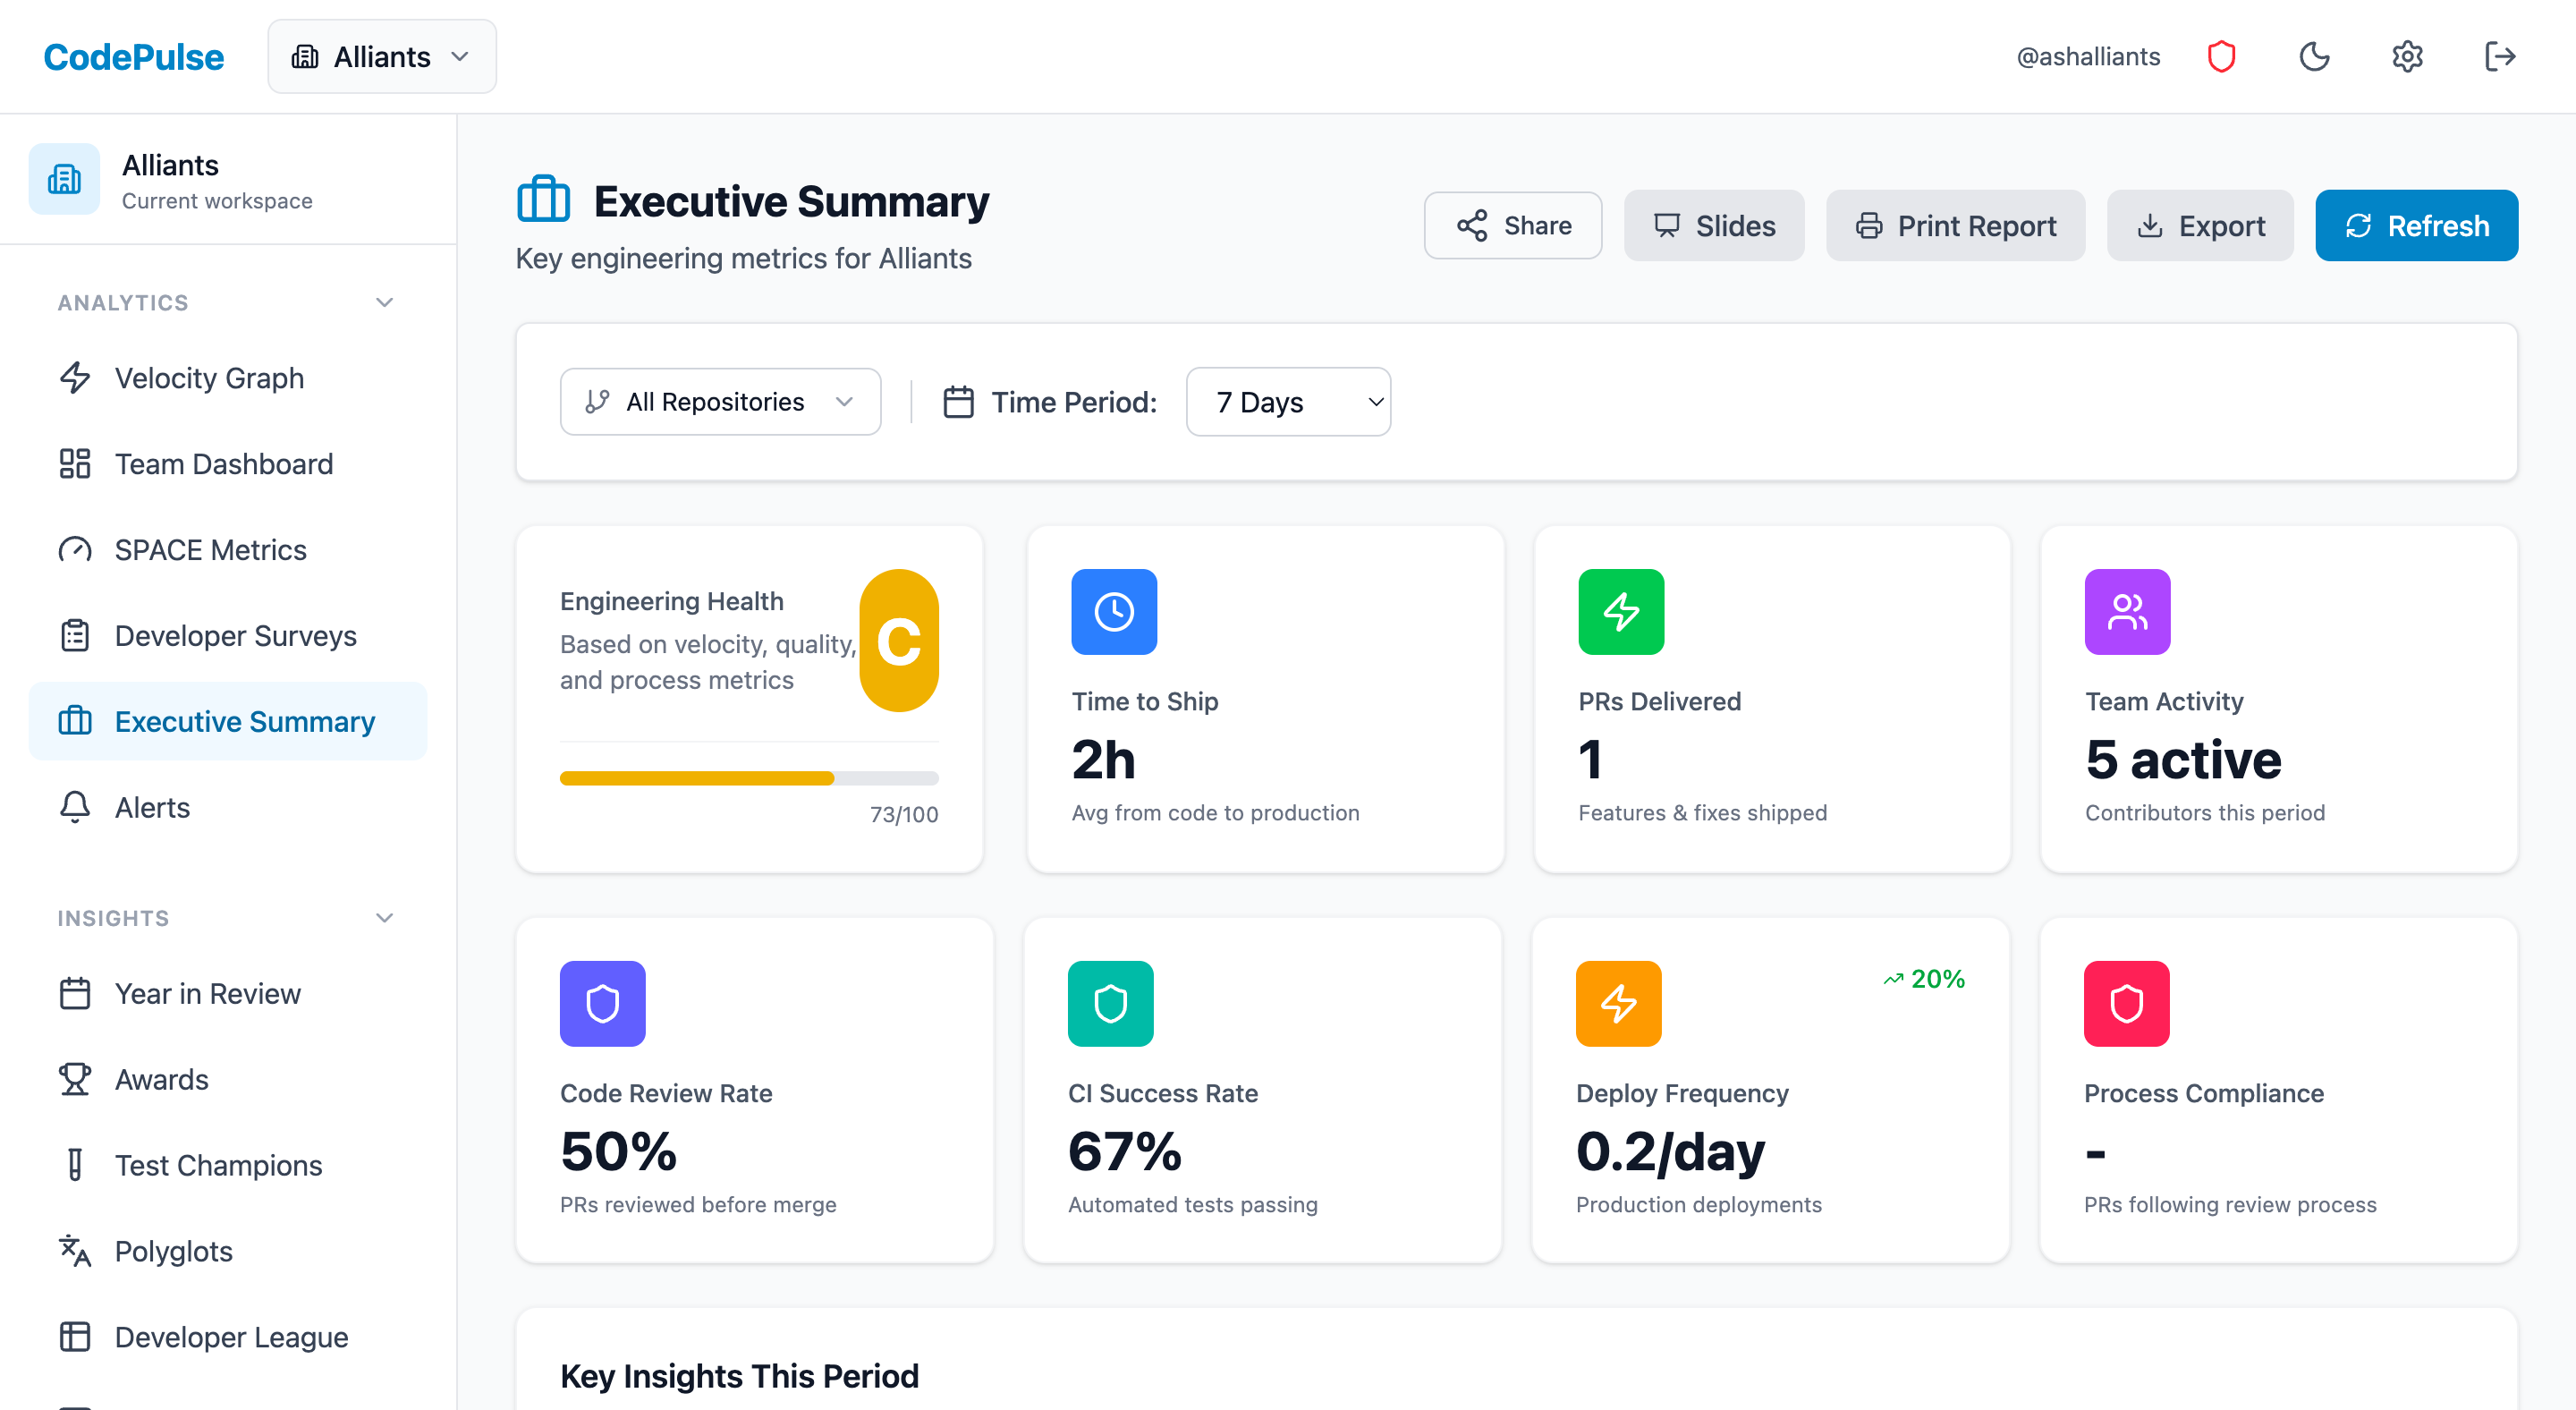
Executive Summary Dashboard
- •One-page summary designed for leadership conversations
- •DORA metrics with industry benchmarking
- •Trend analysis showing quarter-over-quarter progress
- •Export to slides or share directly
Everything You Need to Understand Your Engineering Org
17 capabilities built specifically for engineering leaders who need real answers, not vanity dashboards.
Delivery & Velocity
Break down cycle time into coding, waiting, review, and merge phases.
Track all four DORA metrics and benchmark against industry standards.
Predict delivery timelines based on historical velocity trends.
Track deployment frequency, lead time, and release patterns.
Data-backed retros with concrete metrics for each sprint.
See whether engineering is trending up or down with a Velocity Score across speed, throughput, quality, and collaboration.
Measure end-to-end issue lead time from creation to merge and find where work stalls across Jira or Linear statuses.
Code Quality & Risk
Team & Collaboration
Interactive graph of review relationships and workload distribution.
Compare contribution patterns for coaching, not surveillance.
Measure review thoroughness and feedback quality across the team.
Holistic developer productivity using the SPACE framework.
Run recurring, anonymous developer experience surveys and read team sentiment next to your GitHub delivery data.
Celebrate the healthy, often-invisible behaviours - careful reviews, mentorship, testing - that make teams stronger.
Intelligence & Reporting
Board-ready engineering performance in a single page.
See where engineering effort goes across features, maintenance, and debt.
Get notified when cycle times spike or review patterns degrade.
Measure the real productivity impact of AI coding assistants.
See how your team's delivery metrics rank against similar companies by industry and size, using anonymized opt-in benchmarks.
Connect Jira, Linear, and Azure DevOps so issue context enriches your GitHub-native analytics, with OAuth setup in minutes.
Ready to see your engineering metrics?
Connect your GitHub in 5 minutes. Get instant visibility into your team's velocity, quality, and collaboration patterns.