Find Out If Your Engineering Org Is Actually Strong
Compare your team's delivery metrics against similar companies by industry and size. Get the answer every board asks - are we good, or do we just think we are?
Your metrics mean nothing without context
A 40-hour cycle time looks alarming until you learn it beats most teams your size. Leaders report numbers up the chain with no way to say whether they signal a problem or a win. Internal trends show movement, but never tell you where you stand against the wider market.
Anonymized comparison against teams like yours
Opt in to contribute your anonymized metrics, and CodePulse places your team against a percentile distribution drawn from organizations in your industry and size band. The question shifts from whether you are improving to whether you are strong against the market.
Opt in, stay anonymous
Benchmarking is off by default. When you turn it on, only aggregated and anonymized metrics join the dataset. Nothing identifies your team, and you can opt out at any time.
Match your peer group
Pick your industry from seven categories - SaaS, Fintech, Healthcare, E-commerce, Enterprise, Consumer, or Other - and a team-size band from 1-10 up to 200+ developers, so comparisons reflect companies like yours.
See your percentile, not a ranking of people
Each metric shows where your team lands against the p10 to p90 distribution, with a clear tier from top 10% down to bottom 10%. This measures the team and the system, never individual contributors.
Trust the sample
Comparisons only appear once at least 10 organizations have contributed to your segment, so a percentile reflects a real distribution rather than a handful of outliers.
Key Metrics You Will Track
Percentile Rank
Where your team lands from p10 to p90 against similar organizations, with a top 10% to bottom 10% performance tier
Cycle Time vs Peers
Median time from first commit to merge, compared against teams in your industry and size band
Review Coverage and Quality
Share of PRs reviewed and merge-without-approval rate, benchmarked so you can judge process health, not police people
Delivery and Throughput
Deployment frequency, PRs merged, and PR size measured against the market median for your segment
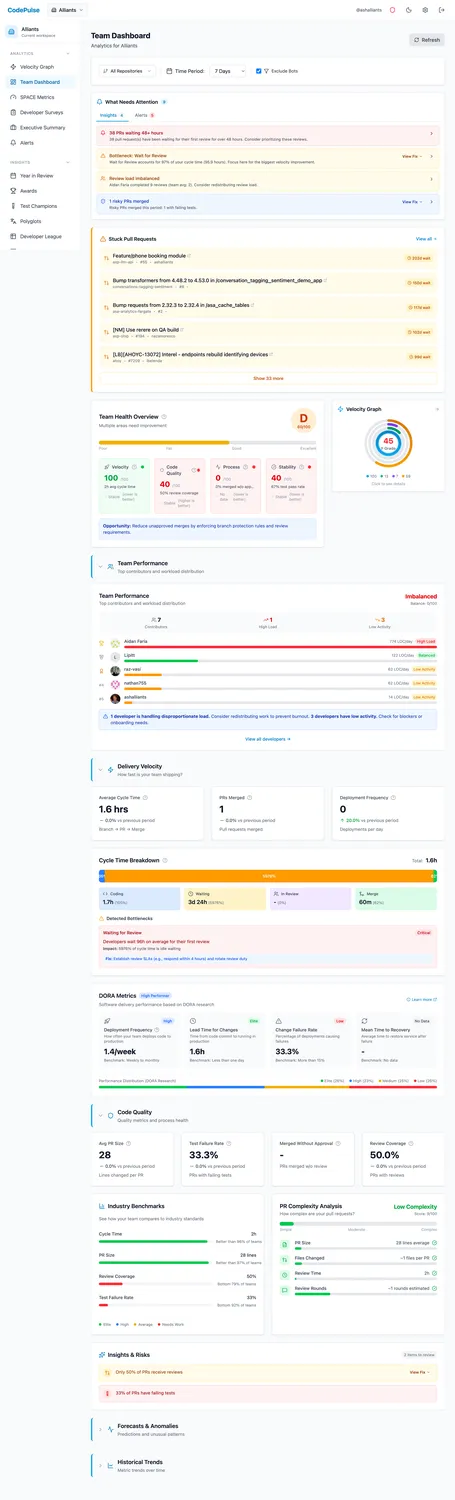
See Industry Benchmarks in Action
Connect your GitHub account and get insights in under 5 minutes. Free forever for small teams.