See these metrics for your own team
CodePulse turns your GitHub history into engineering insights in about 5 minutes. Free to start, no credit card.
Get started freeThis is a complete breakdown of the four DORA metrics - deployment frequency, lead time for changes, change failure rate, and mean time to recovery - based on the research program that studied over 30,000 professionals across seven years. For each metric, you get the definition, benchmark tables, how to measure it from GitHub data alone (no CI/CD required), and the gaming trap that makes it unreliable as a KPI. If you just want the numbers, skip to the four metrics. CodePulse tracks all four automatically with a 15-minute sync cycle from your GitHub repositories.
What are DORA metrics and how should engineering teams use them?
DORA metrics are four measures of software delivery performance: deployment frequency, lead time for changes, change failure rate, and mean time to recovery. The DORA research program developed them after studying over 30,000 professionals across seven years. They work best as diagnostic signals for identifying bottlenecks, not as KPIs or targets. When teams treat them as goals, they game the numbers instead of fixing their actual processes. CodePulse tracks these metrics automatically from GitHub data with a 15-minute sync cycle.
Related guides in this series
- VP Board Metrics - 7 metrics that translate DORA into board-ready language
- Platform Engineering Metrics - why platform teams need different benchmarks for all 4 DORA keys
- Metrics Rollout Playbook - how to introduce DORA tracking without triggering gaming
- Analytics ROI Calculator - quantify the dollar value of improving your DORA scores
"If your team is optimizing for 'elite' status rather than shipping better software, you've already lost."
What DORA Actually Measured (And Why It Matters)
The DORA research program - created by Nicole Forsgren, Jez Humble, and Gene Kim - studied over 30,000 professionals across seven years to understand what separates high-performing software teams from everyone else. Their findings, published in the book Accelerate (2018) and annual State of DevOps reports, identified four metrics that consistently distinguished elite performers.
These metrics matter because they're outcome-based, not activity-based. They measure what actually matters - how quickly and reliably you deliver value to users - rather than vanity metrics like lines of code or commit counts.
🔥 Our Take
DORA metrics were designed for research, not management. Using them as KPIs misses the point entirely.
The original research identified what elite teams do, not how they got there. Goodhart's Law applies: when a measure becomes a target, it ceases to be a good measure. A team that games their way to "elite" deployment frequency while shipping broken code hasn't improved - they've just learned to look good on a dashboard.
What DORA Research Proves (And What It Doesn't)
The research proves:
- Speed and stability aren't trade-offs. Elite teams have both high deployment frequency AND low change failure rates. You don't sacrifice quality for velocity.
- Continuous delivery practices correlate with better outcomes. Teams that deploy frequently, with good automation and testing, perform better.
- These patterns hold across industries. It's not just for startups or tech companies.
The research does NOT prove:
- That targeting "elite" benchmarks will make you better. Correlation isn't causation. Elite teams have good metrics because they have good practices - not the other way around.
- That these four metrics are sufficient. DORA metrics tell you about delivery performance. They say nothing about code quality, developer experience, or whether you're building the right thing.
- That your specific team should aim for specific numbers. The benchmarks are population-level findings. Your context matters. See our guide on how to use engineering benchmarks without gaming them.

Free Download: DORA Baseline Calculator - Calculate your team's DORA performance level instantly and compare against industry benchmarks.
What Are the Four DORA Metrics?
Each of the four metrics is defined below with its benchmark table. To see where your own team lands across all four at once, our free DORA metrics calculator maps your numbers to elite, high, medium, and low in a couple of minutes.
1. Deployment Frequency
What it measures: How often your organization deploys code to production.
What it actually indicates: Deployment frequency is a proxy for batch size. Teams that deploy frequently ship smaller changes. Smaller changes are easier to review, easier to test, and easier to roll back when something breaks.
| DORA Classification | Deployment Frequency |
|---|---|
| Elite | Multiple deploys per day |
| High | Between once per day and once per week |
| Medium | Between once per week and once per month |
| Low | Less than once per month |
The trap: Teams game this by splitting PRs into tiny fragments or deploying empty changes. A team deploying 10 times a day while shipping nothing meaningful isn't "elite" - they're just busy.
2. Lead Time for Changes
What it measures: The time from code commit to production deployment.
What it actually indicates: Lead time reveals the friction in your delivery pipeline. Long lead times point to bottlenecks - slow code review, manual testing gates, complex deployment processes, or approval bureaucracy.
| DORA Classification | Lead Time |
|---|---|
| Elite | Less than one hour |
| High | Between one day and one week |
| Medium | Between one week and one month |
| Low | More than one month |
The trap: Teams optimize for lead time by skipping reviews or reducing test coverage. Your lead time dropped from 3 days to 3 hours - but now you're shipping bugs straight to production.
"A 3-day lead time with thorough review beats a 3-hour lead time with no review. The metric doesn't capture what you skipped."
For detailed benchmarks on PR cycle time (a key component of lead time), see our PR Cycle Time Benchmarks by Team Size.
3. Change Failure Rate
What it measures: The percentage of deployments that cause a failure requiring remediation - rollback, hotfix, or patch.
What it actually indicates: Change failure rate is the quality counterbalance to velocity metrics. High deployment frequency only matters if those deployments work. This metric catches teams that game velocity by shipping broken code.
| DORA Classification | Change Failure Rate |
|---|---|
| Elite | 0-15% |
| High | 16-30% |
| Medium | 16-30% |
| Low | More than 30% |
The trap: Teams game this by under-reporting failures or defining "failure" narrowly. If hotfixes don't count and rollbacks are "planned," your 5% failure rate is a lie.
4. Mean Time to Recovery (MTTR)
What it measures: How long it takes to restore service when an incident occurs.
What it actually indicates: MTTR measures your incident response capability. Low MTTR requires good monitoring (you detect problems fast), good runbooks (you know what to do), and practiced response (you've done this before).
| DORA Classification | MTTR |
|---|---|
| Elite | Less than one hour |
| High | Less than one day |
| Medium | Between one day and one week |
| Low | More than one week |
The trap: Teams game this by not declaring incidents, or by declaring resolution before customers are actually unaffected.
How Do You Measure DORA Metrics Without CI/CD Access?
Most teams don't have unified CI/CD pipelines with comprehensive deployment tracking. Here's how to approximate each metric using GitHub data alone - and what caveats apply.
Deployment Frequency: Use Merge Frequency
If you practice trunk-based development and merging to main triggers deployment, merge frequency approximates deployment frequency.
Deployment Frequency Proxies (GitHub-only):

1. MERGES TO MAIN BRANCH
   - Works if: merge → deploy is automated
   - Caveat: Manual gates create gaps

2. RELEASE TAGS
   - Works if: you tag every release
   - Caveat: Often underreported

3. PR MERGE RATE
   - Count: PRs merged per day/week
   - Caveat: Not all PRs trigger deployments

CodePulse approach:
  - Tracks PRs merged (deployment proxy)
  - Filters to specific branches if needed
  - Shows trend over time for trajectory analysis
Lead Time: Track Deployments When You Can
PR cycle time, from first commit to merge, is a useful delivery metric. True DORA lead time extends from first commit to production deployment, so deployment data gives you the more accurate measure.
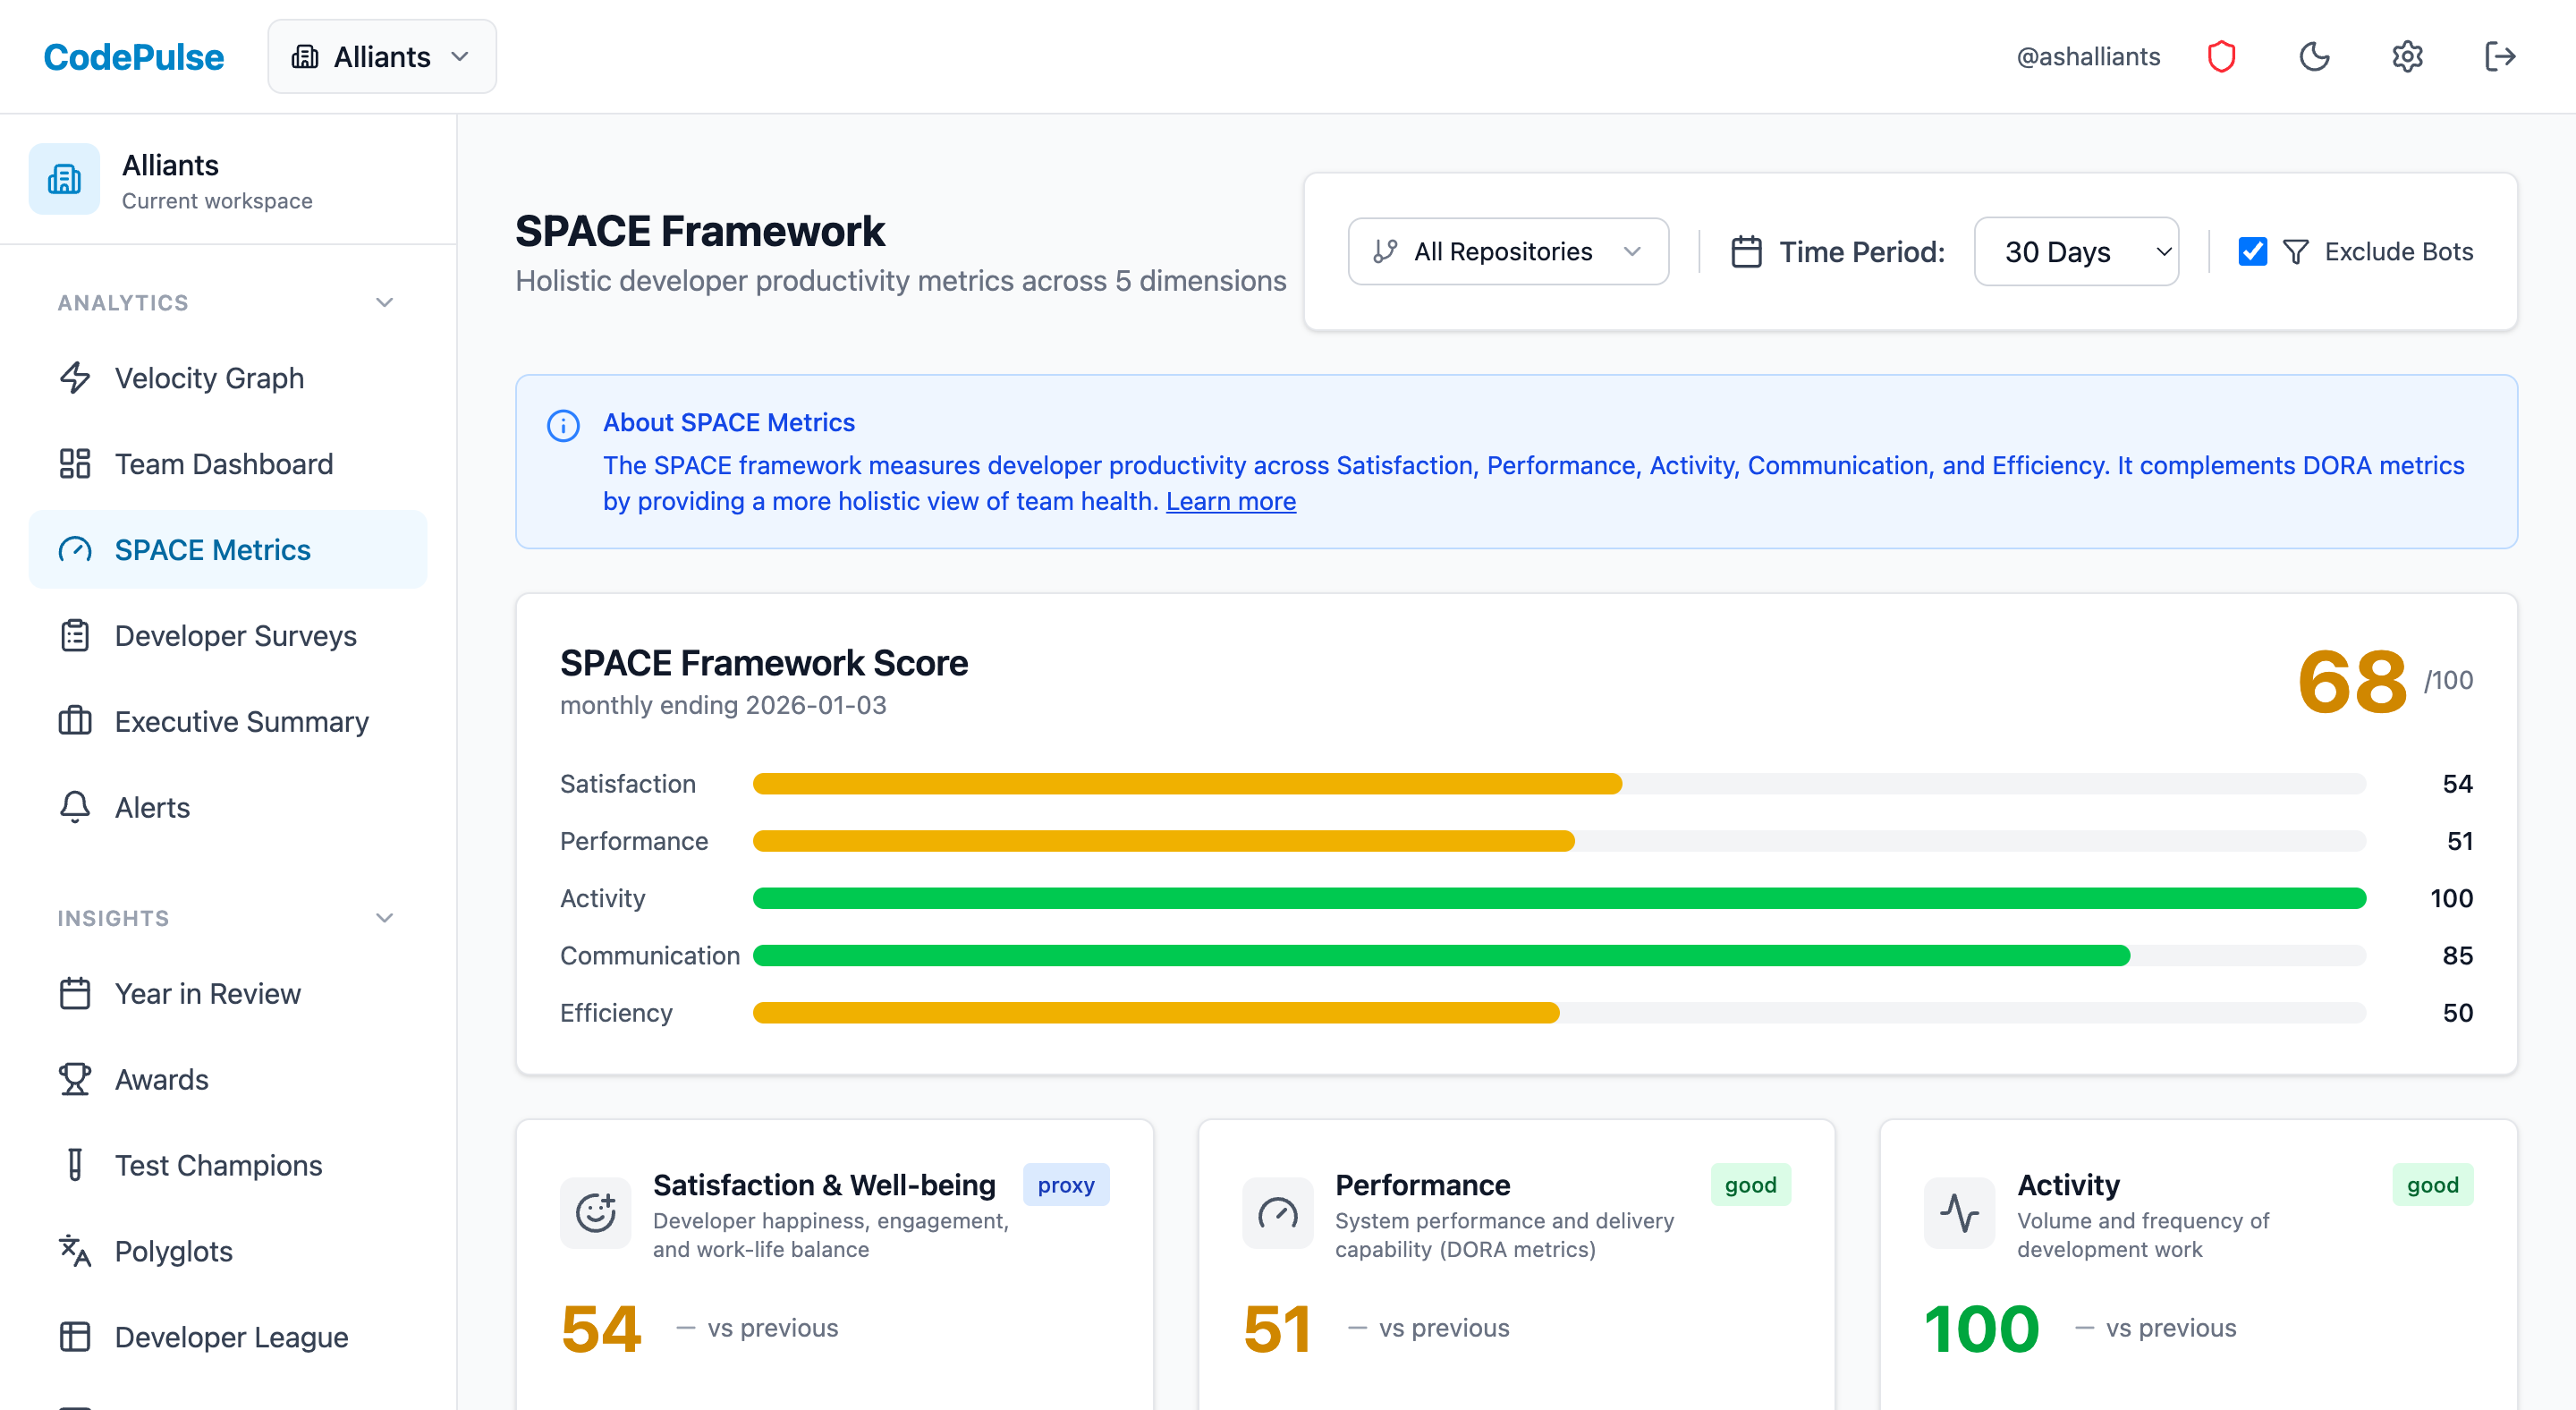
⏱️Measuring Lead Time in CodePulse
CodePulse breaks down cycle time separately from DORA lead time:
- Go to Dashboard to see the Cycle Time Breakdown
- Coding Time - First commit to review request
- Pickup Time - Review request to first review
- Review Time - First review to approval
- Merge Time - Approval to merge
- Total cycle time ≈ lead time minus deployment delay
Change Failure Rate: Track Reverts and Hotfixes
Without incident management data, use these proxies:
- Revert commit ratio: Commits that revert previous changes indicate production issues.
- Hotfix branch frequency: If you use hotfix branches, count them.
- PR failure patterns: High code churn correlates with quality issues.
MTTR: Measure Hotfix Cycle Time
From GitHub alone, you can measure the cycle time of hotfix branches or PRs tagged as fixes. The time from hotfix branch creation to merge indicates recovery speed.
Why Are DORA Benchmarks Misleading?
"The original DORA research surveyed 30,000 people. Your team has 8. The statistics don't transfer."
The DORA benchmark tables are useful for understanding what's possible - but dangerous when used as targets. Here's why:
Context Matters More Than Classification
| Factor | Impact on Reasonable Metrics |
|---|---|
| Regulated industry | Compliance gates slow deployments legitimately |
| Legacy monolith | Architecture limits deployment frequency |
| Hardware dependencies | Can't deploy faster than physical shipping |
| B2B enterprise | Customers may prefer stability over frequent changes |
| Small team | Review bottlenecks are structural, not fixable by process |
A fintech team with a 2-week deployment cycle isn't "low performing" - they're compliant. A medical device company that deploys quarterly isn't broken - they're following FDA requirements.
What to Do Instead
- Establish your own baselines. Measure where you are today. That's your starting point.
- Focus on trajectory. Are your metrics improving? That matters more than the absolute number.
- Investigate outliers. When a metric spikes or drops, find out why. The story matters more than the number.
- Use metrics to find problems, not judge people. Long lead time is a signal to investigate, not a failure to punish.
How Do You Improve DORA Metrics Without Gaming Them?
The right way to improve DORA metrics is to improve the capabilities they reflect - not to optimize for the numbers directly.
To Improve Deployment Frequency
- Reduce batch size. Smaller PRs are easier to review, test, and deploy. See our PR Size Optimization Guide.
- Automate deployments. Manual deployment processes are the biggest barrier.
- Use feature flags. Decouple deployment from release - ship code that's not yet visible to users.
- Build confidence. Good monitoring lets you deploy with less fear.
To Reduce Lead Time
- Speed up code review. This is usually the biggest bottleneck. See our guide to reducing PR cycle time.
- Parallelize CI. Slow test suites add hours to every PR.
- Eliminate manual gates. Each approval step adds delay. Question whether each gate adds value.
- Practice trunk-based development. Long-lived branches accumulate merge conflicts that slow everything down.
To Reduce Change Failure Rate
- Improve test coverage. Automated tests catch issues before production.
- Invest in code review. Human review catches what tests miss.
- Use progressive rollouts. Canary deployments limit blast radius when something breaks.
- Build better staging environments. Production-like environments catch environment-specific issues.
To Reduce MTTR
- Invest in observability. You can't fix what you can't see.
- Create runbooks. Documented procedures speed recovery.
- Practice incident response. Game days build muscle memory.
- Enable easy rollbacks. The ability to undo a deployment instantly drops MTTR dramatically.
🔔Setting Up DORA-Aligned Alerts in CodePulse
Use alerts to catch problems before they become crises:
- Go to Alert Rules
- Set a threshold for cycle time (e.g., alert when average exceeds 72 hours)
- Alert on deployment frequency drops (e.g., fewer than 5 merges/week)
- Monitor churn rate spikes (a proxy for change failure risk)
- See the alerts guide for more patterns
How Should You Implement DORA Metrics?
Here's how to adopt DORA metrics without falling into the gaming trap:
Phase 1: Establish Baselines (Week 1-2)
- Identify your data sources. What can you actually measure? Don't let perfect be the enemy of good.
- Calculate current values. Look at the past 90 days. Get a feel for your current state.
- Document your context. What constraints affect your metrics? Regulatory requirements? Architecture decisions? Team size?
- Share findings without judgment. These are diagnostic numbers, not performance grades.
Phase 2: Investigate, Don't Target (Week 3-4)
- Find the bottlenecks. If lead time is long, which component is slowest? Review? Testing? Deployment?
- Understand the root causes. Is slow review caused by PR size? Reviewer availability? Unclear ownership?
- Choose one improvement area. Don't try to fix everything at once.
- Define a practice change, not a metric target. "We'll reduce PR size to under 400 lines" is better than "We'll reduce lead time to 2 days."
Phase 3: Improve Practices (Ongoing)
- Implement the practice change. Focus on the behavior, not the metric.
- Monitor metrics as a side effect. The numbers should improve because the practices improved.
- If metrics don't improve, question your theory. Maybe smaller PRs weren't the actual bottleneck.
- Celebrate practice adoption, not metric gains. "We shipped 80% of PRs under 400 lines this month" is more meaningful than "Our lead time dropped 20%."
The Right Mindset for DORA Metrics
DORA metrics are useful when you treat them as signals - indicators that something might need attention. They're harmful when you treat them as goals - numbers to be achieved.
The DORA research identified what elite teams look like. It didn't provide a recipe for becoming elite. There's no shortcut. You improve by building better practices, not by targeting better numbers.
Use DORA metrics to start conversations: "Why did lead time spike last month?" Use them to detect problems early: "Deployment frequency is trending down - what's blocking us?" Use them to validate improvements: "After we switched to trunk-based development, cycle time dropped 40%."
Don't use them to judge teams. Don't use them to set performance targets. Don't compare yourself to "elite" benchmarks from organizations with completely different contexts.
For more on measuring team health without creating perverse incentives, see our guides on measuring team performance without micromanaging, understanding cycle time breakdown, and deployment frequency and lead time.
Frequently Asked Questions
The four DORA metrics are deployment frequency (how often you deploy to production), lead time for changes (time from commit to production), change failure rate (percentage of deployments causing failures), and mean time to recovery (how long it takes to restore service after an incident). They were identified by the DORA research program as consistent indicators of high-performing software teams.
See these insights for your team
CodePulse connects to your GitHub and shows you actionable engineering metrics in minutes. No complex setup required.
Free tier available. No credit card required.
See These Features in Action
Track all four DORA metrics and benchmark against industry standards.
Board-ready engineering performance in a single page.
Related Guides
Engineering Metrics Dashboard: The 7 Metrics You Need
Skip vanity metrics. Here are the 7 engineering metrics VPs actually need to track team performance, delivery, and quality.
We Cut PR Cycle Time by 47%. Here's the Exact Playbook
A practical playbook for engineering managers to identify bottlenecks, improve review processes, and ship code faster - without sacrificing review quality.
Engineering Metrics That Won't Get You Reported to HR
An opinionated guide to implementing engineering metrics that build trust. Includes the Visibility Bias Framework, practical do/don't guidance, and a 30-day action plan.
Measure Deploy Frequency Without CI/CD (The Hack)
Master DORA deployment frequency and lead time using GitHub data alone, without requiring CI/CD pipeline access.
7 KPIs That Separate Great VPs From Struggling Ones
The essential metrics for VPs of Engineering, Directors, and CTOs. Covers executive dashboards, DORA metrics, team health, and stakeholder communication.
How to Measure Engineering Productivity (Without Spying)
A practical guide to engineering productivity - what it really means, how to measure it without surveillance, and frameworks that work.
Your PR Cycle Time Is Fine (Here's the Benchmark)
What is a good PR cycle time? Benchmarks and targets based on team size, industry, and engineering maturity.
I Got $2M in Budget With These 5 Engineering Metrics
Learn how to create engineering metrics presentations that resonate with board members, investors, and C-suite executives.