Know if your engineering team is trending up or down, and why
Velocity Trends turns months of GitHub activity into one read on team direction. A composite Velocity Score combines speed, throughput, quality, and collaboration, so a faster team that ships broken or unreviewed code never looks healthy. Velocity is a signal, not a target.
You can feel the team slowing down, but you cannot prove it
Most leaders track velocity through gut feel and end-of-quarter retros. A single throughput number tells you how many PRs merged, but not whether quality held, whether reviews kept up, or whether last month was better than this one. So slowdowns surface late, after a deadline slips, and the conversation turns into opinion versus opinion instead of a shared view of the trend.
One score, four dimensions, and a trend you can act on
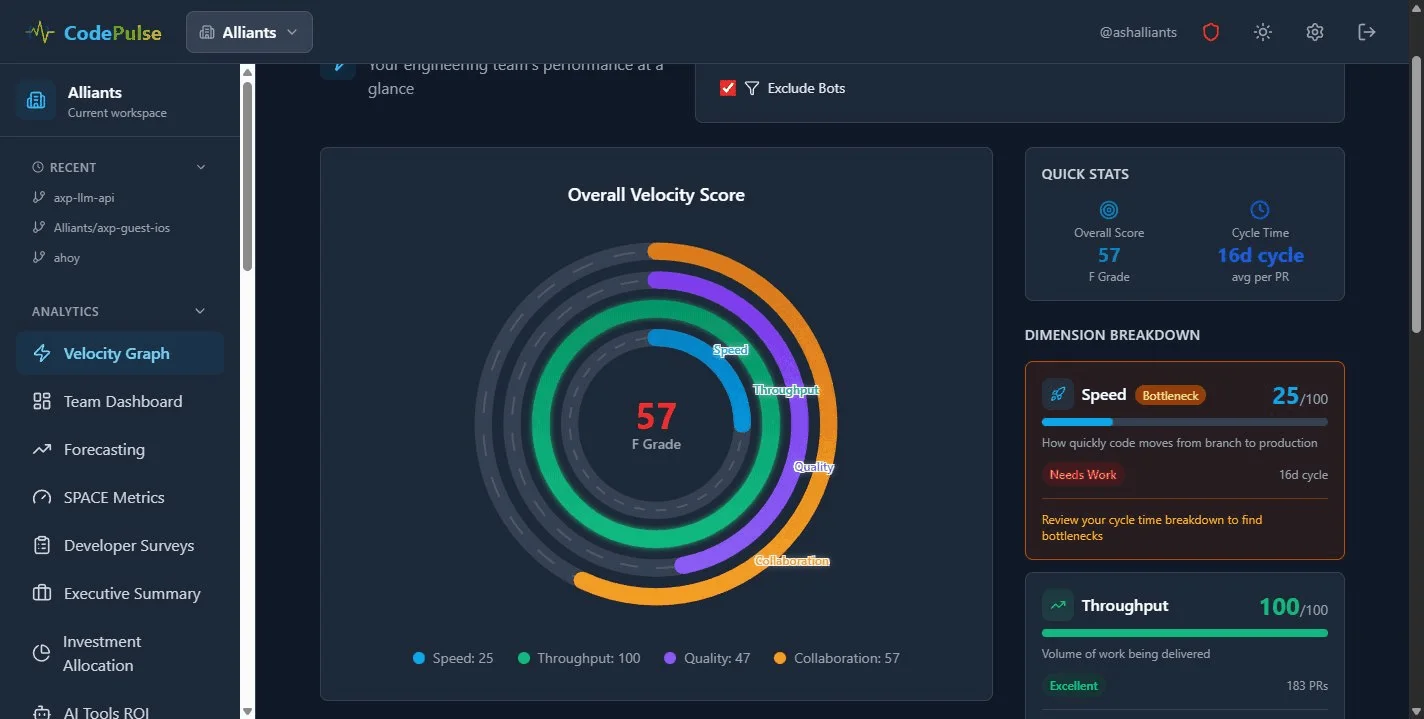
CodePulse reads your GitHub history and builds a Velocity Score from four dimensions that pull against each other on purpose. Speed comes from cycle time, throughput from PRs merged and deploy frequency, quality from test pass rate and review coverage, and collaboration from review coverage and approval rates. A team only scores well when all four hold together.
Connect GitHub in about five minutes
CodePulse is GitHub-native. Install the app, pick your repositories, and the trend builds from your existing history with no agents and no instrumentation in your codebase.
Read the composite Velocity Score
The score blends speed, throughput, quality, and collaboration into one number with a letter grade. A team that ships fast but skips review or breaks the build will not score well, because every dimension counts.
Find the bottleneck
CodePulse flags the lowest-scoring dimension and names the specific phase holding the team back, such as review wait time or test failures, so the next improvement is obvious rather than guessed.
Watch the trend, not the moment
The cycle time trend chart aggregates by day, week, or month across your chosen range. The same time, repository, and bot filters apply everywhere so the numbers stay comparable.
Key Metrics You Will Track
Composite Velocity Score
One score and letter grade built from speed, throughput, quality, and collaboration, so balanced teams score well and one-dimensional teams do not
Cycle Time Trend
Average time from first commit to merge, charted by day, week, or month so you can see whether delivery speed is improving or slipping
Throughput
PRs merged across the team for the selected period, weighted into the score rather than treated as a standalone target
Bottleneck Callout
The lowest-scoring dimension is surfaced with the specific phase to address next, turning the score into a clear improvement
Related Features
Break down cycle time into coding, waiting, review, and merge phases.
Track all four DORA metrics and benchmark against industry standards.
Predict delivery timelines based on historical velocity trends.
See Velocity Trends in Action
Connect your GitHub account and get insights in under 5 minutes. Free forever for small teams.