See Who Reviews Whose Code — And Who Doesn't
Interactive network visualization of review relationships. Find the 2-3 people who review everything, and the ones who never get asked.
The same 2 people review everything
Most teams have an invisible review bottleneck: a handful of senior developers who review 80% of PRs while others barely participate. This creates delays, silos, and burnout.
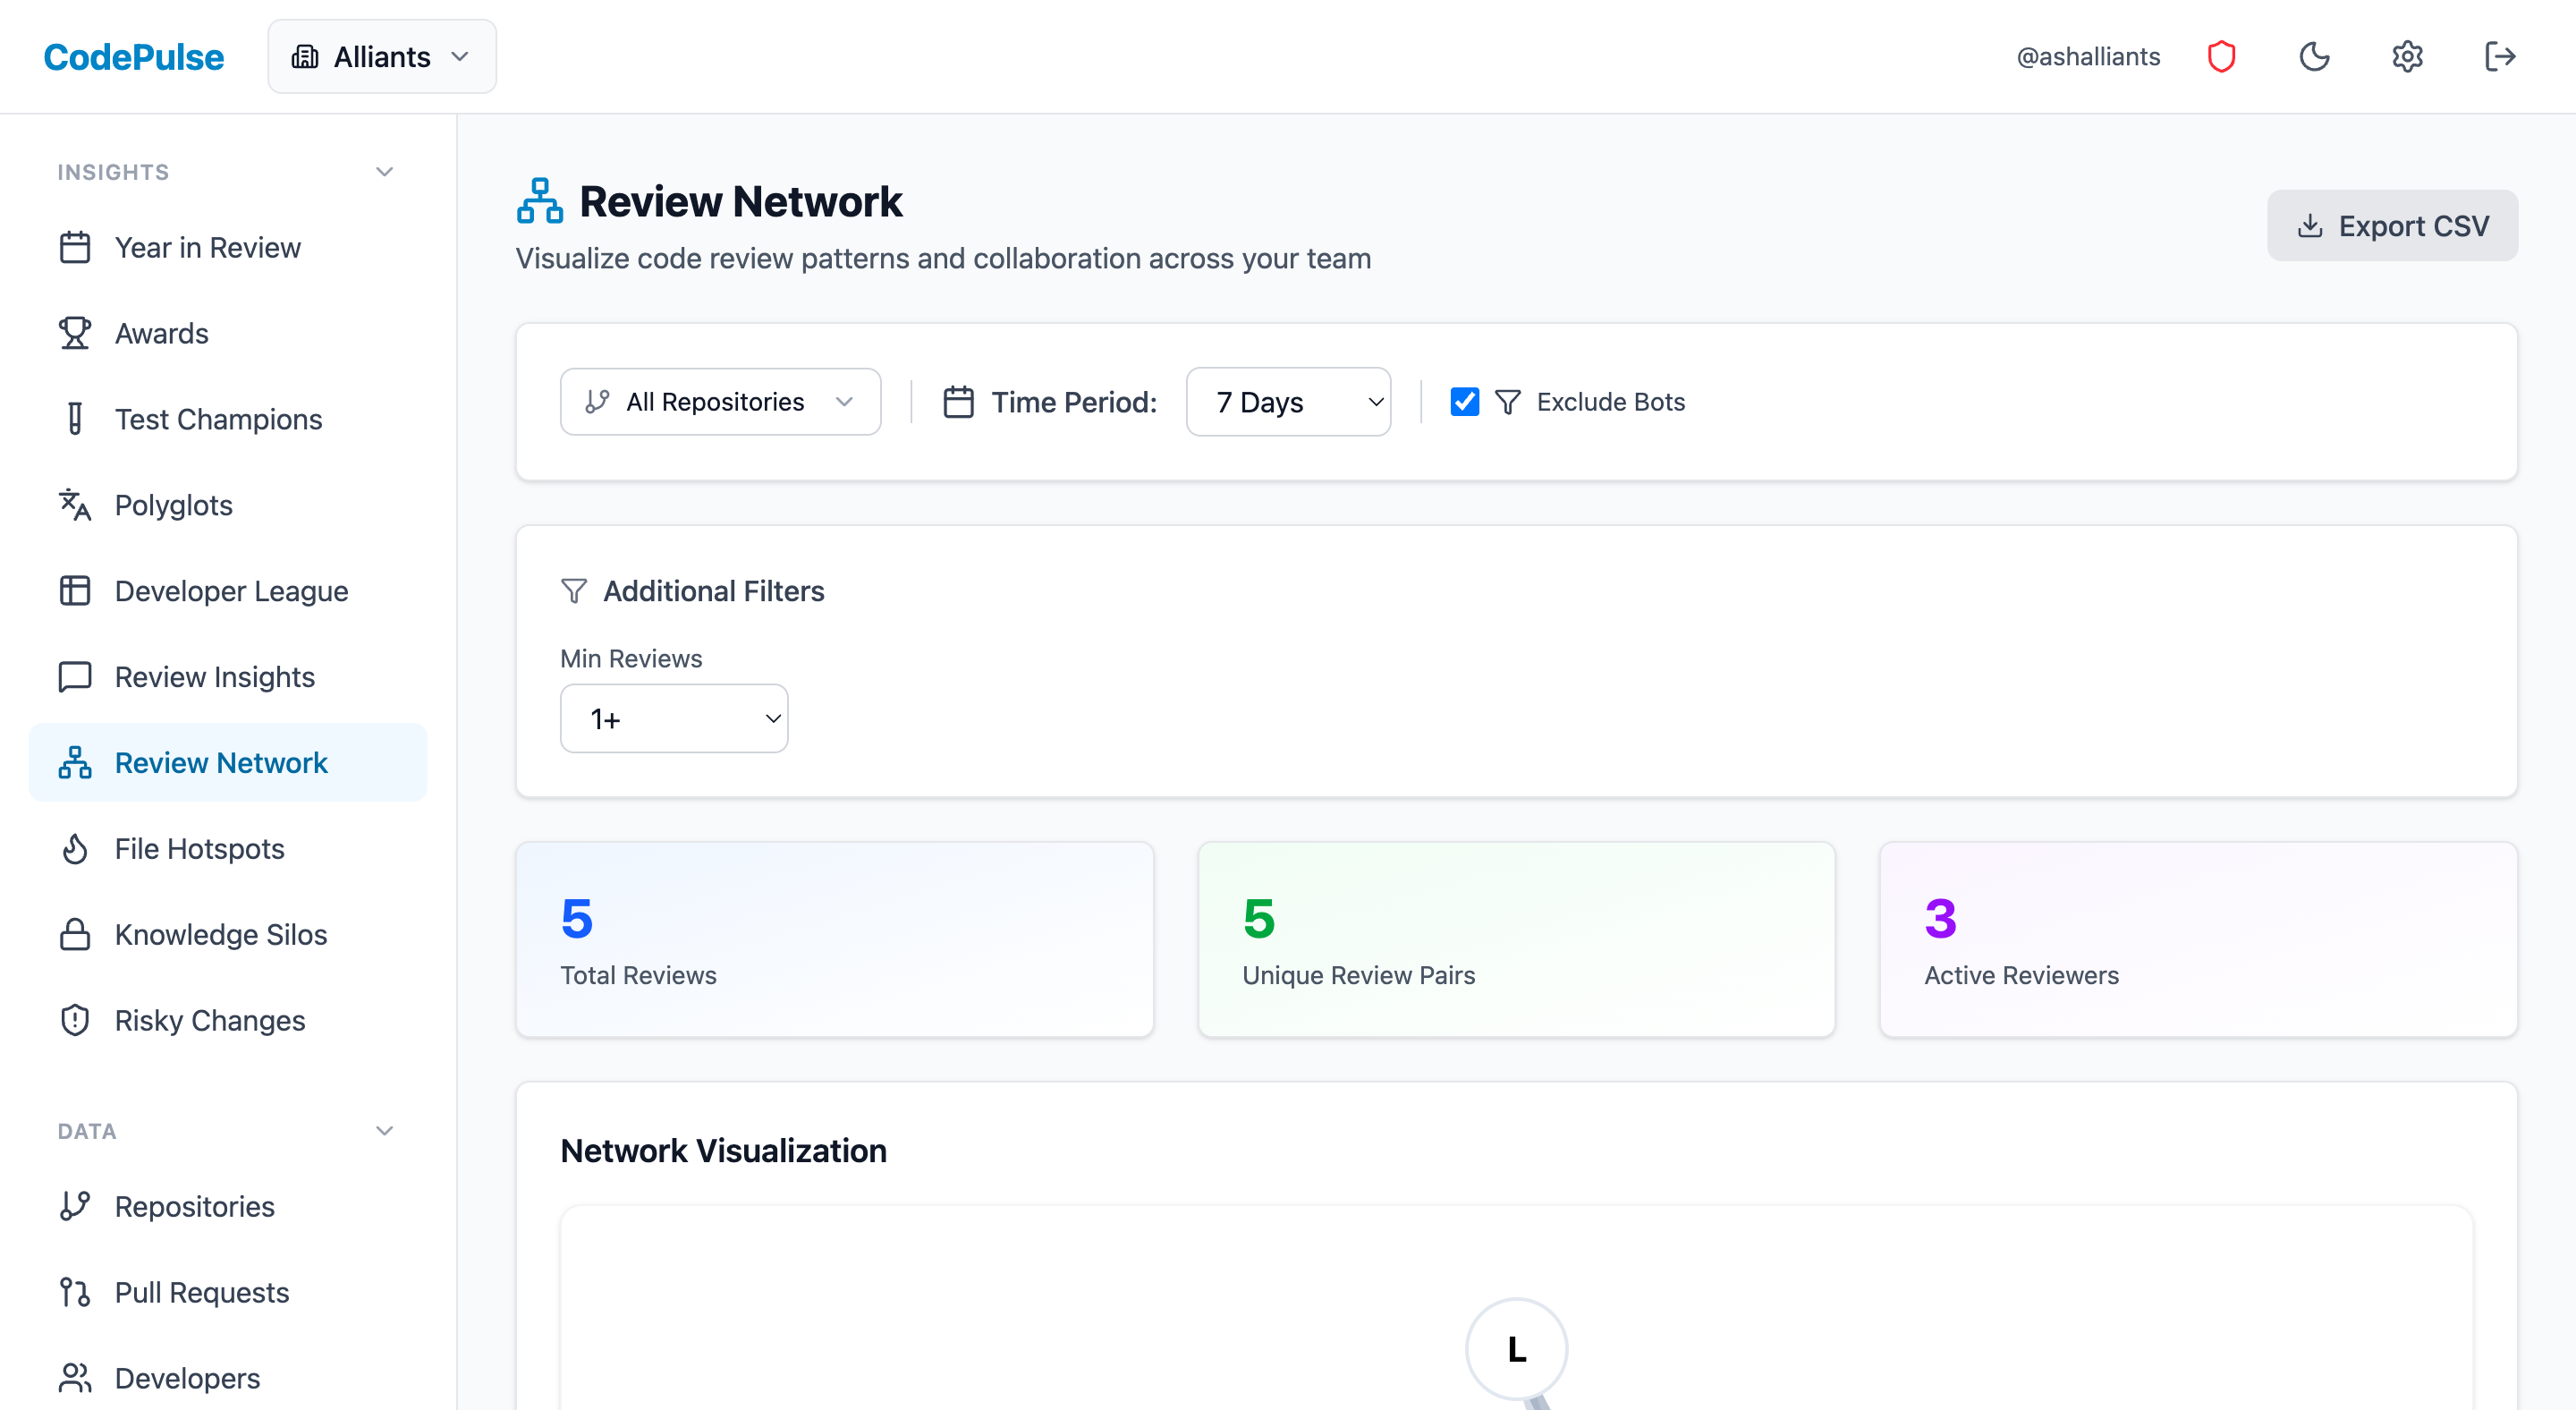
Review Collaboration Map
An interactive force-directed graph showing every review relationship on your team, weighted by frequency.
Relationship Mapping
See directional review relationships — who requests reviews from whom, and how often.
Bottleneck Detection
Spot over-concentrated reviewers with outsized node sizes in the graph.
Isolation Detection
Find team members with no review connections — potential knowledge silo risks.
Load Balancing
Review-to-author ratio metrics help distribute load fairly across the team.
Key Metrics You Will Track
Review Load Ratio
Reviews given vs. PRs authored per developer
Avg Reviews/PR
Number of reviewers per pull request
Review Coverage
Percentage of PRs with at least one review
Self-Merge Rate
PRs merged without any peer review
See Code Review Network Analysis in Action
Connect your GitHub account and get insights in under 5 minutes. Free forever for small teams.