Hear What The Dashboard Cannot Show You
Pull request data tells you what your team shipped. It cannot tell you whether your engineers are frustrated with their tooling, stretched thin, or about to leave. Developer experience surveys give the team a voice, and put that voice next to the GitHub data you already trust.
Delivery looks fine until someone resigns
Throughput holds steady right up to the day a senior engineer hands in notice. By then the cost is already paid - a backfill that takes months, knowledge that walks out the door, and a team that quietly absorbs the gap. Raw metrics are a lagging signal for how people feel. Burnout is a management failure, not a personal one, and you cannot manage what you only find out about in an exit interview.
Surveys and system data in one place
CodePulse runs developer experience surveys where your engineering data already lives. You see how the team feels next to cycle time, review load, and PR throughput - qualitative signal and quantitative signal read together. Surveys are developmental and team-first. They are never used to rank individuals.
Build your question set
Create and order your own questions, or start from a default set covering satisfaction, well-being, tools, team, and process. Choose the format that fits each question - 5-point Likert, 7-point Likert, NPS, or free text.
Set the cadence
Run surveys weekly, monthly, or quarterly. Surveys appear to signed-in developers and respect your frequency and participation rules, so people are asked at a steady rhythm rather than buried in reminders.
Collect honest feedback
Responses are anonymous by default, so people answer truthfully. The admin view never exposes who left an anonymous response, regardless of role, so the anonymity promise holds.
Read feeling against reality
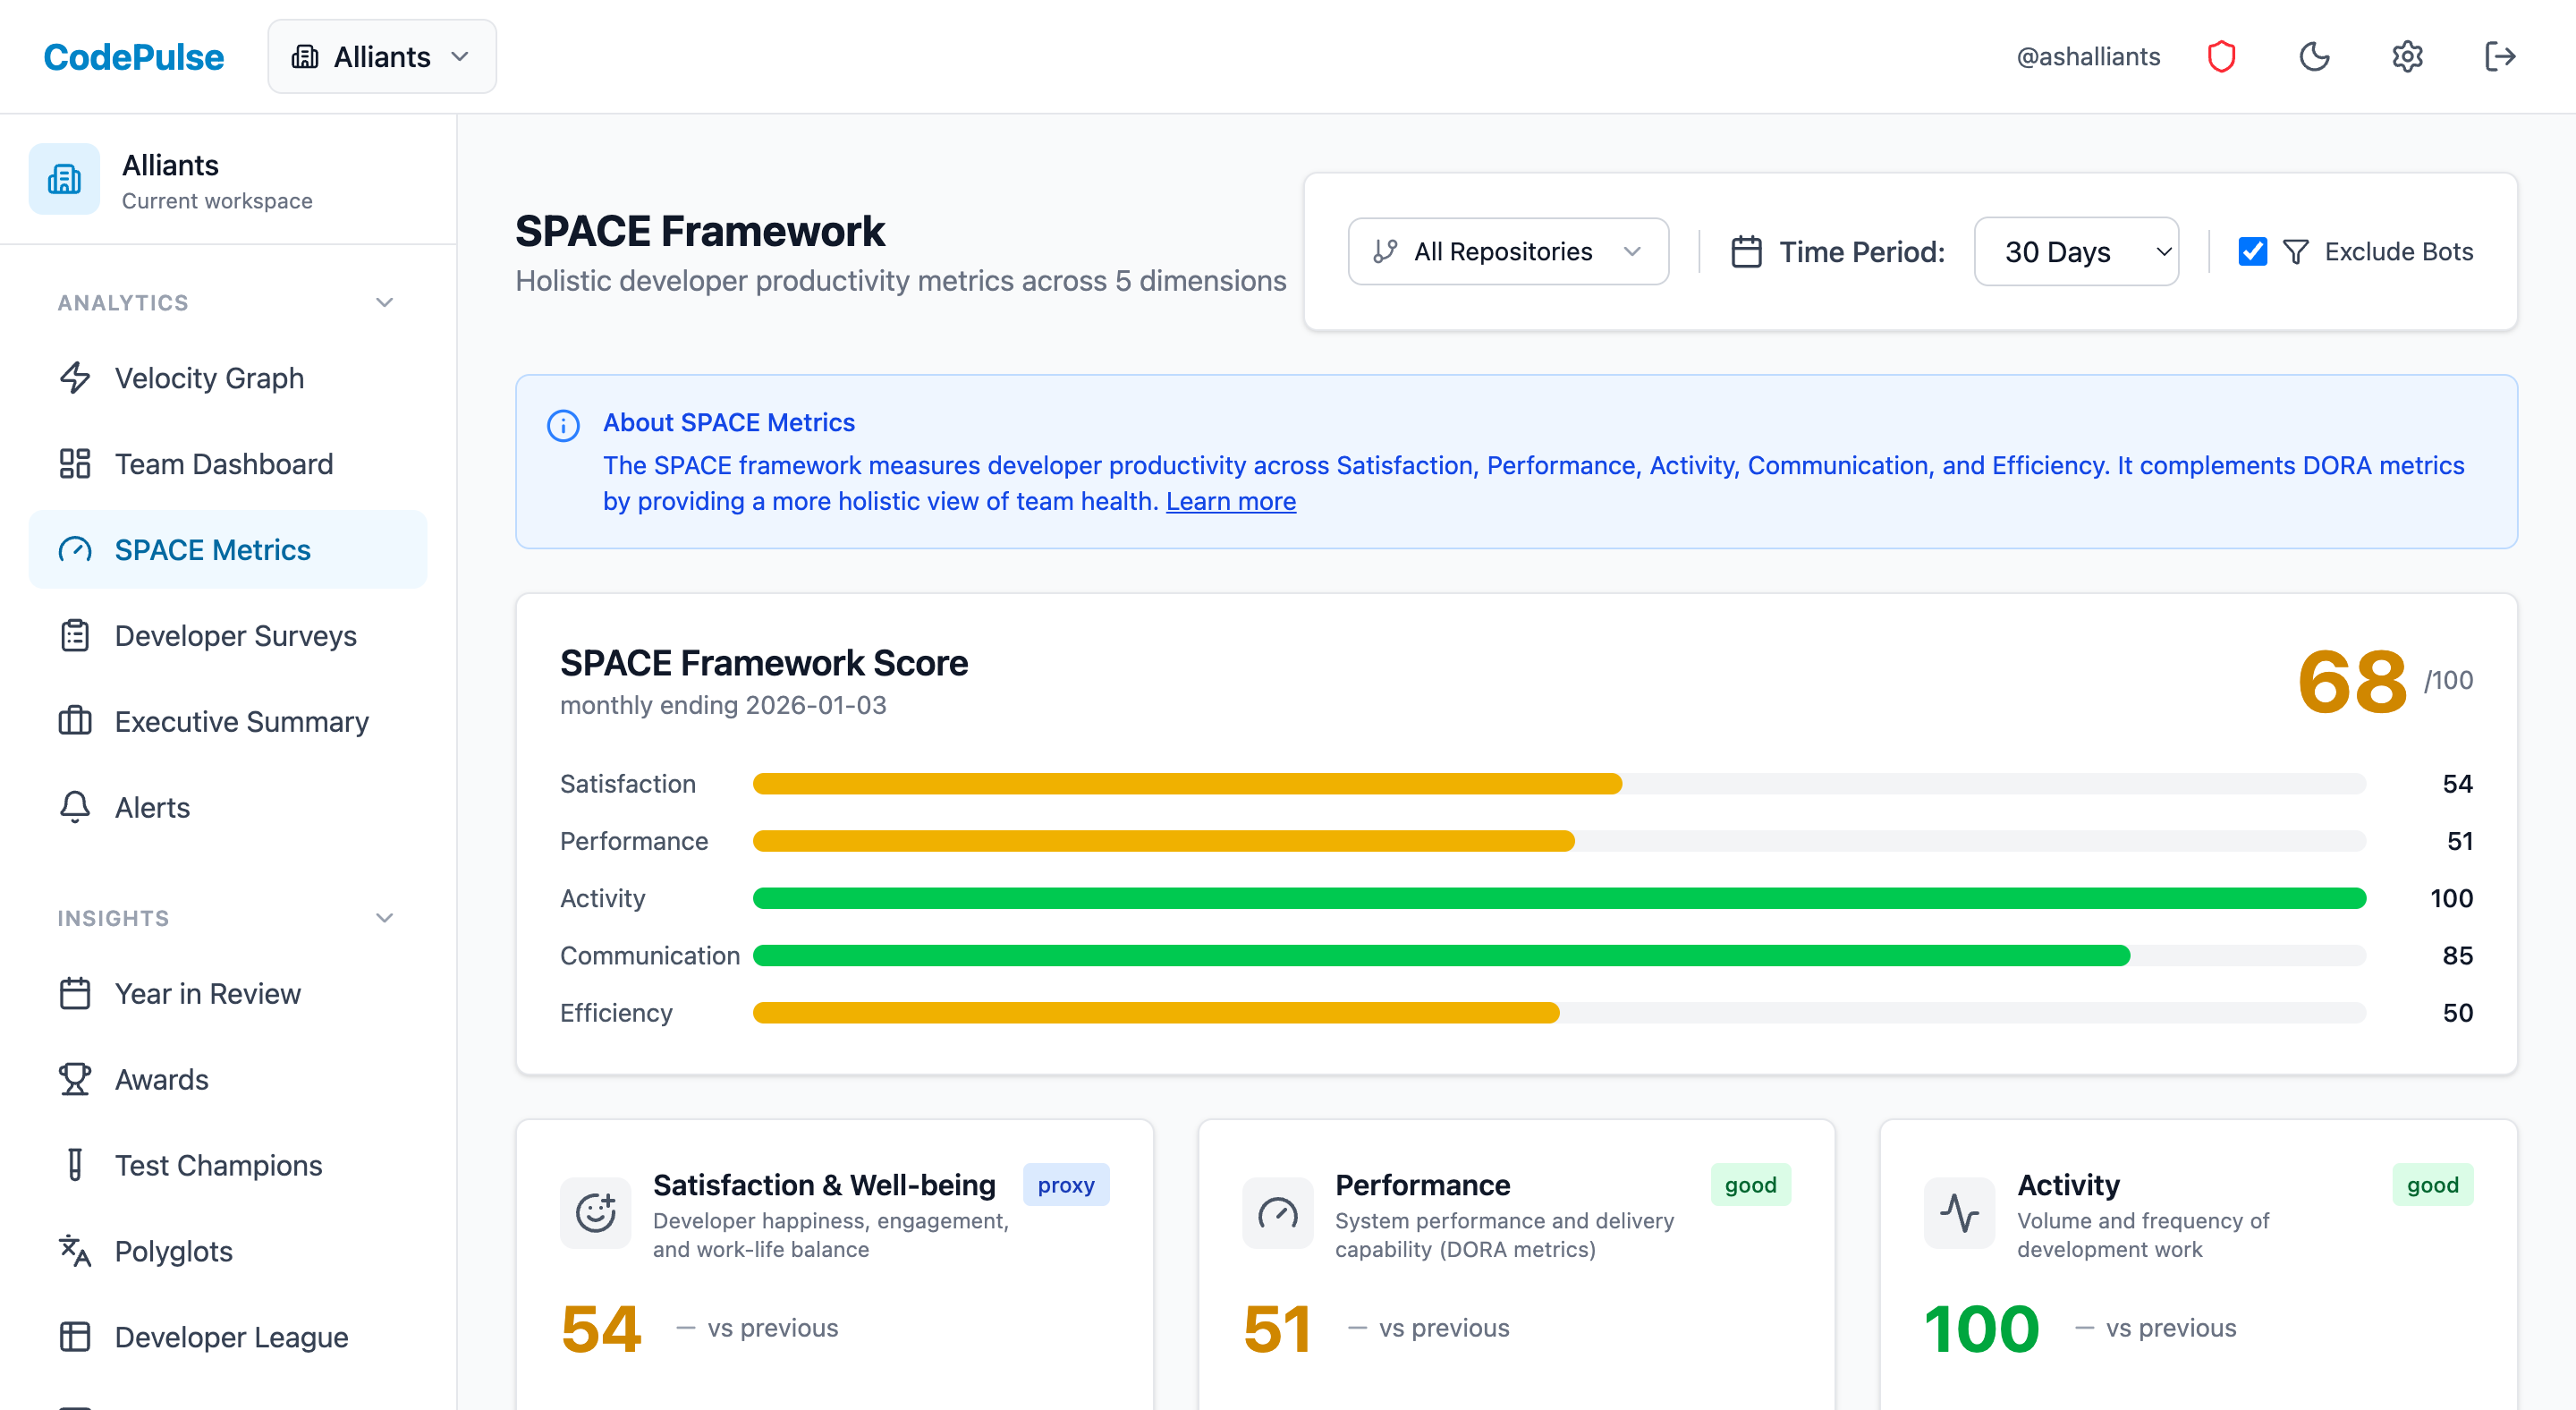
Track category scores over time, review responses, and feed satisfaction into the SPACE dimension alongside your GitHub delivery metrics. When sentiment dips while review load climbs, you see both signals together.
Key Metrics You Will Track
Category Scores
Average scores across satisfaction, well-being, tools, team, and process, so you know which part of the experience needs attention
Participation Rate
The share of the team responding each period - a direct read on whether people feel heard
Sentiment Over Time
Weekly trend lines per category reveal whether morale is recovering or sliding before it shows up in delivery
SPACE Satisfaction
Survey scores feed the satisfaction dimension of the SPACE framework, sitting next to performance and activity data
See Developer Experience Surveys in Action
Connect your GitHub account and get insights in under 5 minutes. Free forever for small teams.