Board-Ready Engineering Metrics in 60 Seconds
A single-page view of engineering performance designed for non-technical stakeholders. Health grades, DORA benchmarks, and trend data.
Explaining engineering to the board should not take a week
Every quarter, VPs of Engineering scramble to build slide decks explaining team performance. The data is scattered, the narrative is unclear, and the audience does not speak engineering.
One Dashboard, One Story
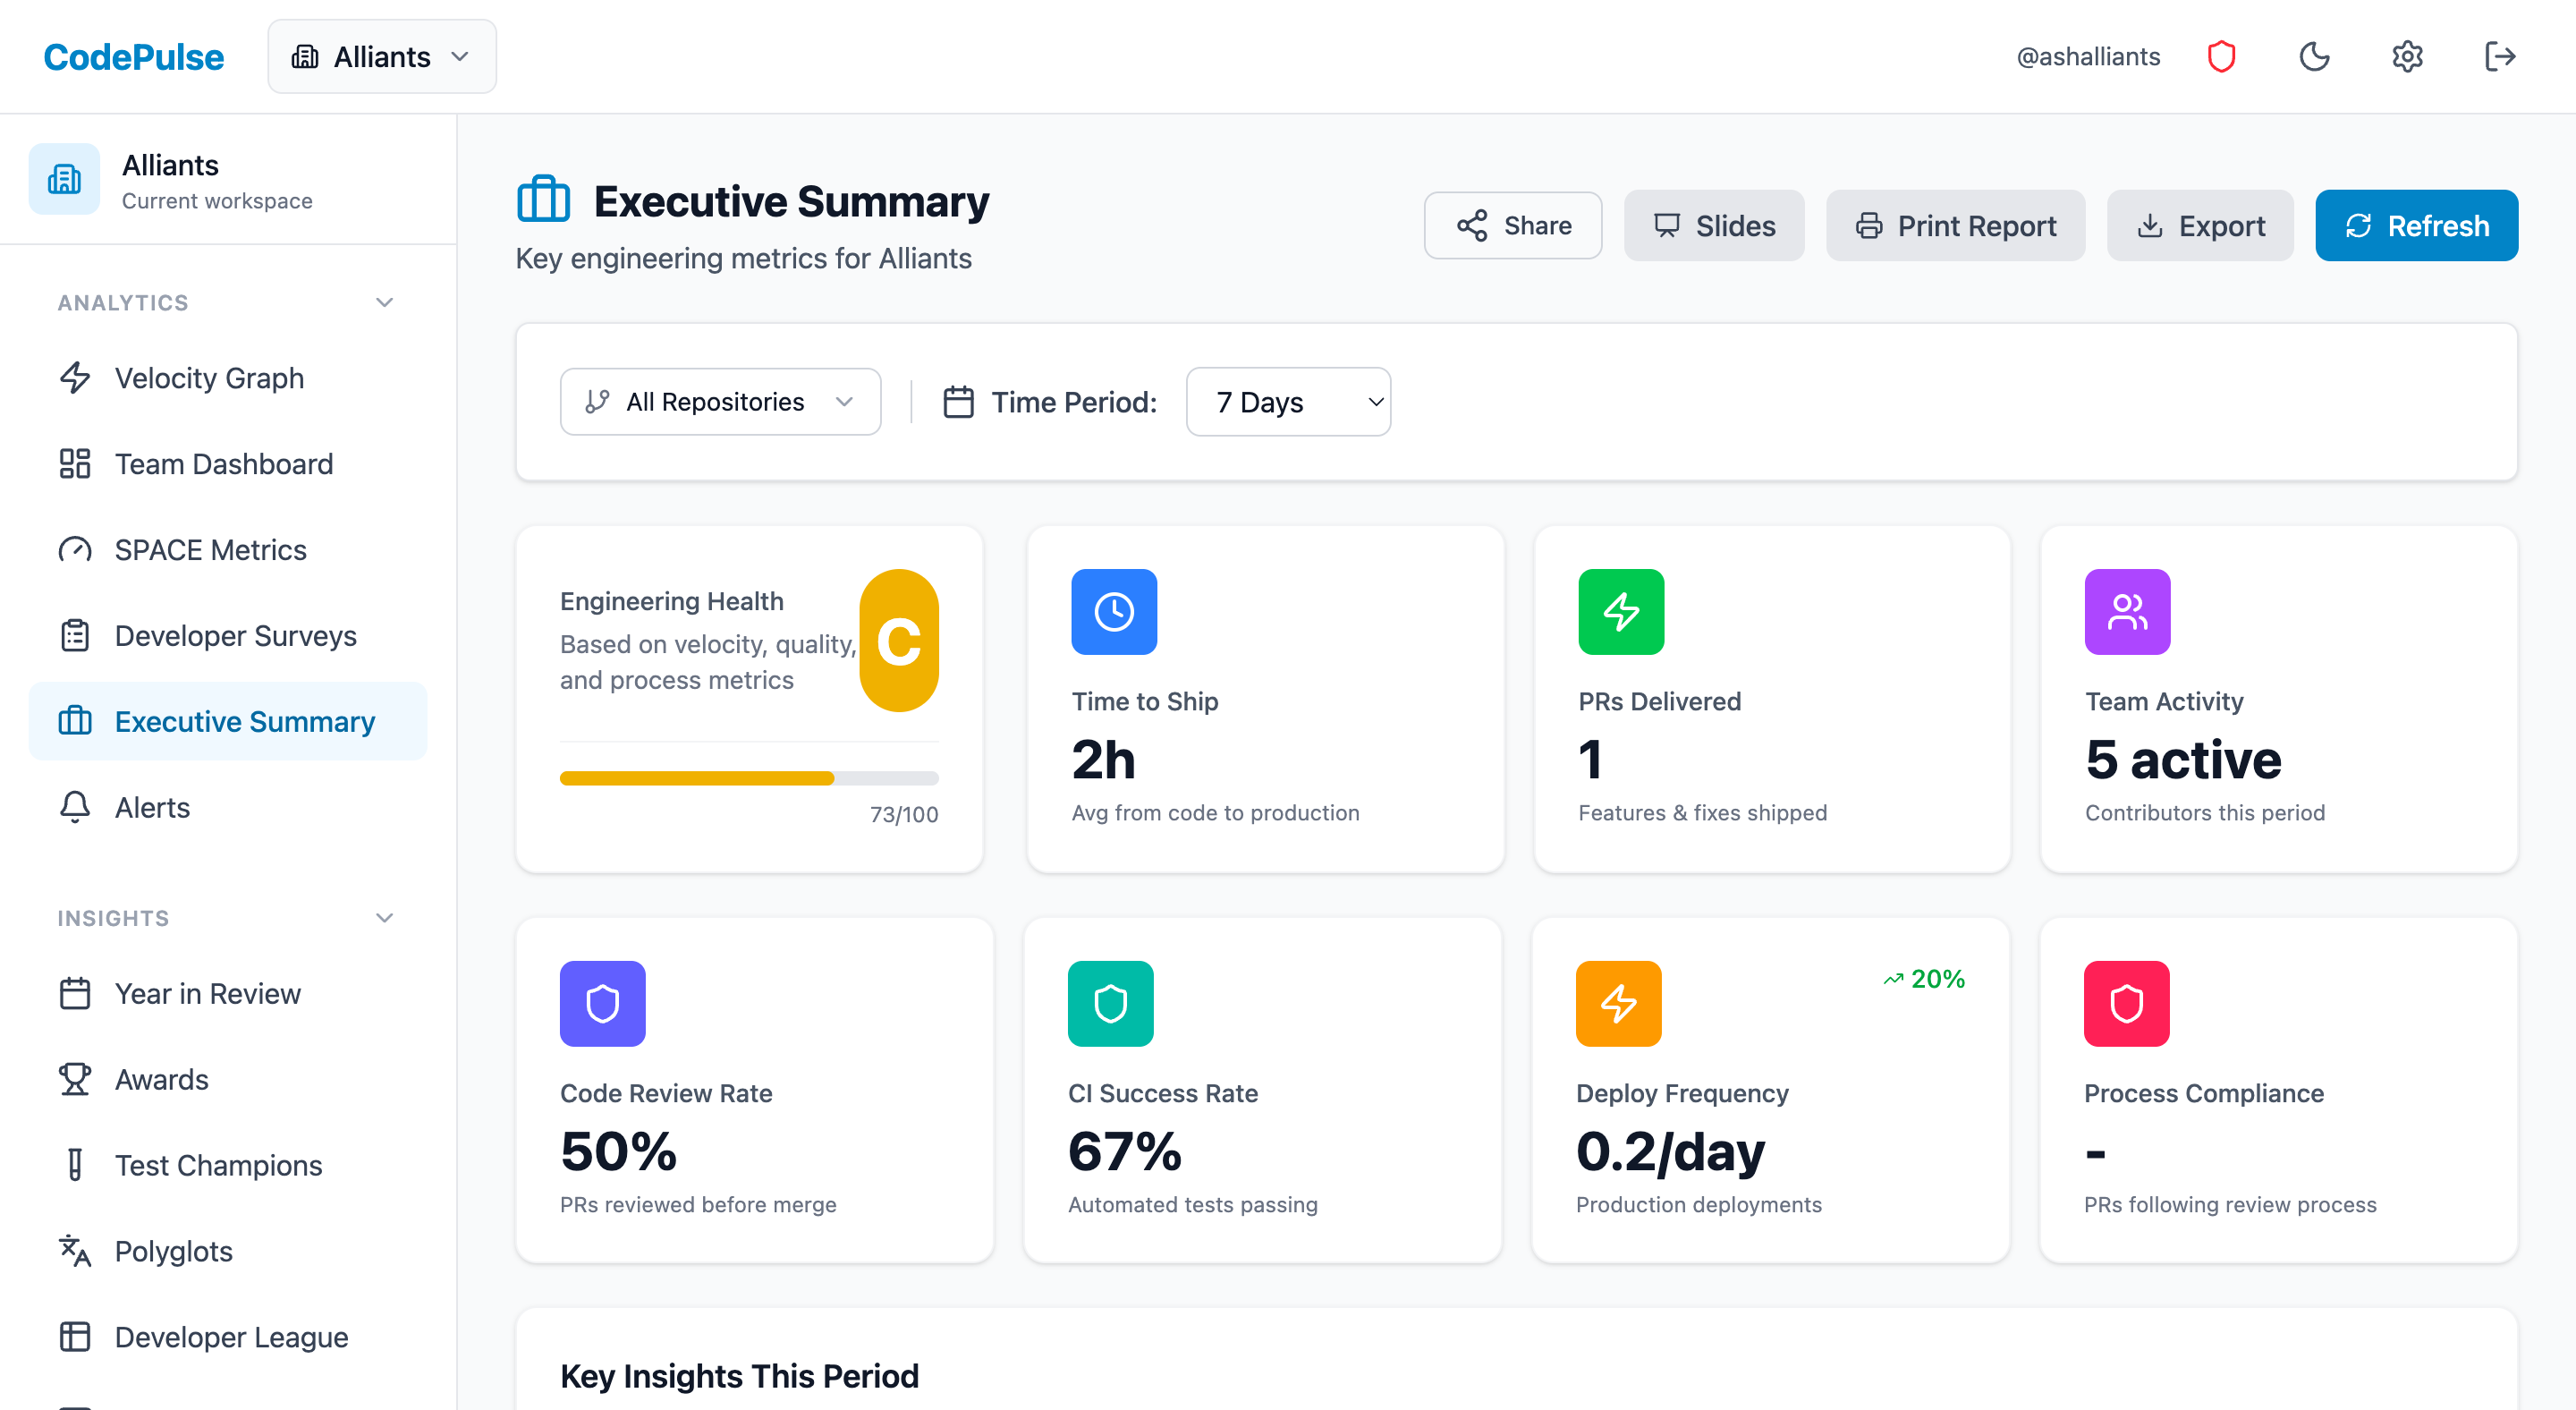
CodePulse generates a single-page executive summary with everything a CEO or board member needs to understand engineering performance.
Health Grade (A-F)
An aggregate score across velocity, quality, and collaboration. Simple enough for any audience.
DORA Benchmarks
Your DORA metrics compared against industry standards — Elite, High, Medium, or Low.
Trend Analysis
Quarter-over-quarter trends showing improvement trajectory or regression.
Export Ready
Share directly or export for slide decks. No manual data assembly required.
Key Metrics You Will Track
Health Grade
Aggregate A-F score across all dimensions
DORA Tier
Industry performance benchmark
QoQ Trend
Quarter-over-quarter improvement direction
Team Health
Burnout signals and workload balance
“I used to spend a full day building engineering reports. Now I just share the CodePulse executive summary link.”
Related Features
Track all four DORA metrics and benchmark against industry standards.
Compare contribution patterns for coaching, not surveillance.
See where engineering effort goes across features, maintenance, and debt.
See Executive Engineering Summary in Action
Connect your GitHub account and get insights in under 5 minutes. Free forever for small teams.