See Exactly Where Engineering Time Goes
Break down every pull request into coding, waiting, review, and merge phases. Find the bottleneck that is actually slowing your team down.
You can't improve what you can't see
Leaders know delivery is slow but can not explain why. Is it coding taking too long? Reviews sitting idle? Unclear handoffs? Without phase-level visibility, every standup is guesswork.
The 4-Stage Pipeline Model
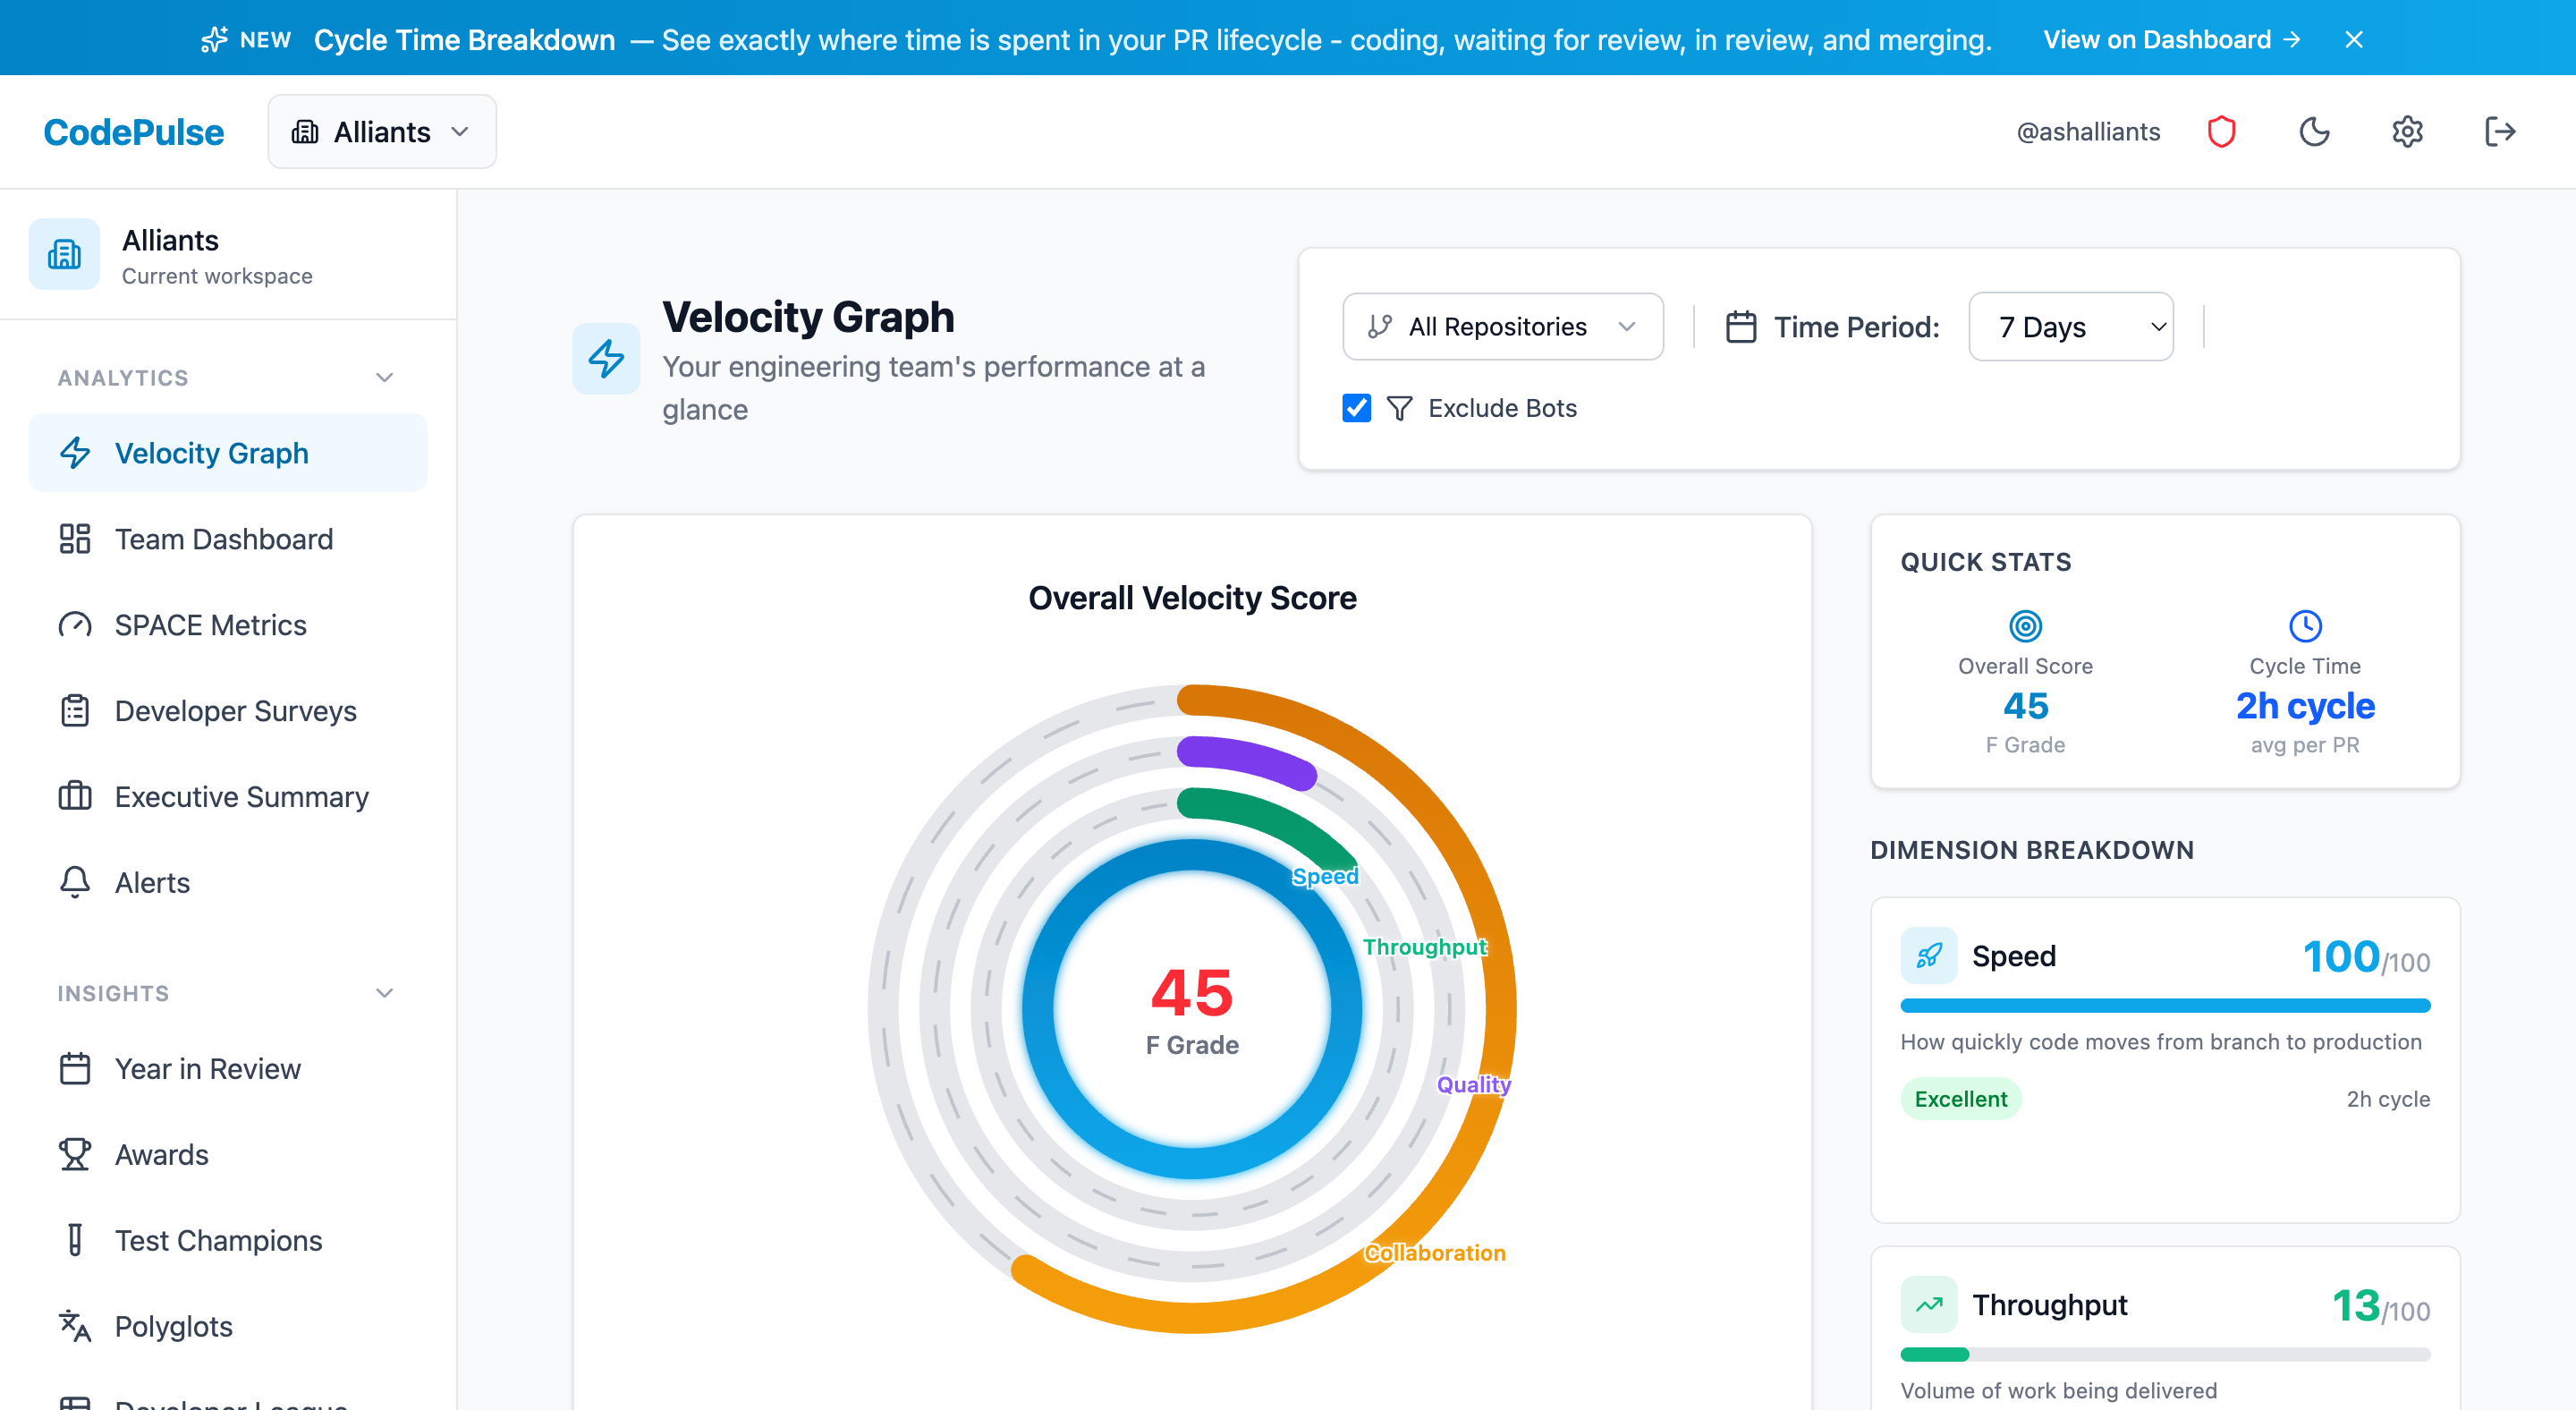
CodePulse breaks every PR lifecycle into four distinct phases, measured automatically from your GitHub data.
Coding Phase
Time from first commit to PR open. See if developers are batching work or shipping incrementally.
Waiting for Review
Time from PR open to first review. The biggest bottleneck for most teams — and the easiest to fix.
In Review
Time from first review to approval. Track review thoroughness vs. rubber-stamping.
Merge Phase
Time from approval to merge. Detect CI/CD delays, merge conflicts, and forgotten PRs.
Key Metrics You Will Track
Median Cycle Time
End-to-end time from first commit to merge
Wait for Review
Average time PRs sit before first review
Review Duration
Time spent in active review
Merge Delay
Time between approval and merge
“We found that 92% of our cycle time was waiting for review. Fixed in 3 weeks with simple reviewer rotation.”
Related Features
Track all four DORA metrics and benchmark against industry standards.
Interactive graph of review relationships and workload distribution.
Predict delivery timelines based on historical velocity trends.
See PR Cycle Time Analytics in Action
Connect your GitHub account and get insights in under 5 minutes. Free forever for small teams.