
Understand the system around the team, not a developer leaderboard
Preview team-level workload, collaboration, and delivery signals designed for process improvement rather than performance grading.
Read-only GitHub · Your code stays yours · Team-level by default · No credit card
Engineering analytics has a dark side. The same tools that promise "visibility" and "productivity insights" often deliver something far more sinister: keystroke logging, screenshot capture, browser monitoring, and activity tracking that treats developers like assembly line workers. This surveillance approach doesn't just violate privacy - it actively destroys the trust and psychological safety that high-performing teams require.
"The moment you install software that watches what developers type, captures their screens, or monitors which websites they visit, you've declared war on your own team. You'll get compliance. You'll lose their best work."
This guide defines what "non-invasive" actually means, explains why privacy-first measurement produces better outcomes, and shows you how to get meaningful engineering insights without becoming the kind of employer that talented people warn each other about.
How do you get engineering analytics without surveillance?
Measure the work, not the worker: read Git, PR, and deployment metadata instead of screens, keystrokes, or activity. Peer-reviewed research (Schlund & Zitek, Communications Psychology 2024) found monitoring framed as evaluative more than quadrupled complaints - and the effect disappeared when measurement was framed as developmental. Tools like CodePulse apply this by analyzing team-level Git signals (cycle time phases, review networks, knowledge silos) with individual views reserved for debugging, never ranking.
The Surveillance Problem in Engineering Analytics
What Surveillance Analytics Look Like
The surveillance software market has exploded, particularly since the shift to remote work. Before reaching for any of these, it's worth asking whether you actually need a management platform at all - our engineering management software guide covers the genuine categories (the ones teams benefit from) distinct from the surveillance category described below. These tools promise "employee monitoring" and "productivity measurement" through techniques that would be considered unacceptable in any other professional context:
- Keystroke logging: Recording every character typed, including passwords, personal messages, and private communications
- Screenshot capture: Taking periodic screenshots of employee screens, often without their knowledge
- Application monitoring: Tracking which applications are open and for how long
- Browser history tracking: Recording every website visited, including personal browsing
- Mouse movement tracking: Monitoring physical activity patterns at the computer
- Webcam activation: Taking photos of employees through their webcams
- "Productivity scores": Reducing complex knowledge work to a single number based on surveillance data
"Any company that needs to take screenshots of developer screens to know if work is happening has already failed at management. You don't have a visibility problem - you have a trust problem, and surveillance will make it worse."
Why Surveillance Destroys Engineering Productivity
The irony of surveillance analytics is that they claim to improve productivity while actually destroying it. Here's why:
The Surveillance Paradox
"The most valuable engineering work happens during focused, uninterrupted thinking. Architecture decisions, debugging complex systems, and creative problem-solving require deep concentration."
"Surveillance creates constant awareness of being watched. This cognitive overhead fractures concentration and makes deep work nearly impossible."
"Developers optimize for looking busy rather than being effective. Screen time goes up. Innovation goes down. Your best people start interviewing."
Research consistently shows that surveillance reduces creativity, risk-taking, and collaboration - exactly the behaviors that distinguish great engineering teams. You get developers who are physically present and actively disengaged.
🔥 Our Take
Surveillance is the coward's substitute for management.
If you can't tell whether your team is productive without watching their screens, you've failed at the basics: clear goals, meaningful deliverables, and regular communication. Surveillance tools aren't management tools - they're an admission that you don't know how to lead. Great engineers have options. They will leave. You'll be left with the people who have nowhere else to go.
What "Non-Invasive" Actually Means
The Bright Line
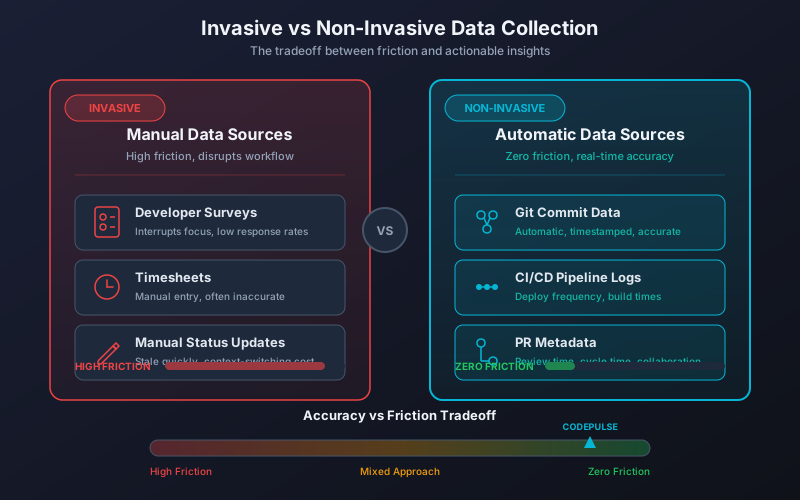
Non-invasive engineering analytics draws a clear line: we measure work outputs, not work behavior. The distinction matters:
| Invasive (Never) | Non-Invasive (Acceptable) |
|---|---|
| Keystroke logging | Commit frequency and patterns |
| Screenshot capture | Pull request cycle time |
| Browser/app monitoring | Code review participation |
| Mouse/keyboard activity | Deployment frequency |
| Webcam surveillance | Team velocity trends |
| "Active time" tracking | Review coverage percentage |
| Productivity scores | Knowledge distribution |
The Key Principle
Non-invasive analytics measures what was produced, not how it was produced. We care that code was reviewed thoroughly, not whether the reviewer was sitting at their desk or on their couch. We care that the team shipped features, not whether they did it between 9-5 or at hours that work for them.
"If your measurement system can't distinguish between a developer who solved a complex problem in 2 hours and one who took 8 hours on busywork, you're measuring the wrong things. Non-invasive analytics focuses on value delivered, not time spent."
What Non-Invasive Analytics Never Does
- Never installs agents on developer machines that capture screen content, keystrokes, or application usage
- Never monitors network traffic to track websites visited or communications content
- Never activates hardware like webcams or microphones
- Never generates "activity scores" based on mouse movements or typing patterns
- Never correlates work hours with productivity in a way that punishes efficiency
- Never creates individual rankings or leaderboards that pit developers against each other
Data Sources That Respect Privacy
The Git-Only Approach
The most privacy-respecting approach to engineering analytics uses only data that developers already create as part of their normal workflow: Git commits, pull requests, and code reviews. For a tooling-level look at the open and vendor ecosystems that operate purely on Git metadata, see our Git metadata analysis tools roundup. This data is:
- Already shared: Developers know this data exists because they created it deliberately
- Work-focused: It captures what was produced, not behavior or activity
- Team-oriented: Git data naturally aggregates to team level, discouraging individual surveillance
- Context-rich: Commit messages and PR descriptions provide context that raw metrics lack
Data source comparison
- Screen recording and screenshots
- Keyboard and mouse activity logs
- Browser history and app usage
- Calendar mining for "meeting load"
- Slack message analysis
- Email content scanning
- Git commits and branches
- Pull request metadata
- Code review comments and approvals
- CI/CD pipeline status
- Deployment events
- Issue tracker linkages
Why Git Data Is Sufficient
Some managers worry that Git-only analytics misses important information. In practice, the opposite is true. Git data captures the actual work of software development:
- Throughput: How much code is being shipped?
- Cycle time: How fast does work flow from idea to production?
- Quality signals: Are PRs being reviewed? What's the churn rate?
- Collaboration patterns: Who reviews whose code? Where are the silos?
- Risk indicators: Large PRs, unreviewed merges, knowledge concentration
Everything else is either vanity metrics (lines of code) or surveillance (screen time). Git data gives you what you need without crossing ethical lines.
Building Trust While Measuring
Transparency as the Foundation
Non-invasive analytics isn't just about what data you collect - it's about how you use it. Trust requires radical transparency:
- Show everyone the same data: No secret dashboards for managers. If you can see it, your team can see it.
- Explain methodology: How is each metric calculated? What are its limitations? Document and share.
- Commit to use boundaries: State clearly what you will and won't do with the data. Put it in writing.
- Invite feedback: Let developers question metrics and suggest changes. They know their work better than any dashboard.
For a complete guide on building trust with engineering metrics, see our Engineering Metrics Trust Guide.
Team-Level Focus
The safest metrics are team-level metrics. When you measure teams rather than individuals:
- No individual ranking: You can't compare Alice to Bob when the unit of measurement is the team
- Shared ownership: The team succeeds or struggles together, which encourages collaboration
- Built-in context: Team members know why numbers moved because they lived it
- Harder to game: Individual gaming hurts team metrics, creating natural resistance
Learn more in our guide on measuring team performance without micromanaging.
The Consent Framework
Even with non-invasive data, meaningful consent matters. A robust consent framework includes:
Privacy-First Implementation Checklist
Before Implementation
- Document exactly what data will be collected
- Explain how data will be used (and how it won't)
- Get input from developers on what feels acceptable
- Create written commitments about data usage
- Establish an appeal process for metric disputes
At Launch
- Give all team members access to the same dashboards
- Train managers on ethical metric interpretation
- Make individual opt-out available where possible
- Set up feedback channels for concerns
Ongoing
- Regular reviews of what data is actually being used
- Quarterly "are these metrics useful?" surveys
- Remove metrics that aren't providing value
- Celebrate examples of positive metric use
The CodePulse Privacy Philosophy
CodePulse was built from the ground up on privacy-first principles. We believe that effective engineering measurement and developer privacy aren't in tension - surveillance is simply bad engineering management, and we refuse to enable it.
What CodePulse Collects
- Git metadata: Commits, branches, pull requests, and reviews
- PR lifecycle events: Created, reviewed, approved, merged timestamps
- Code change statistics: Additions, deletions, files changed (not code content)
- Review relationships: Who reviewed which PRs
- CI/CD status: Build pass/fail from GitHub Actions
What CodePulse Never Collects
- No agents: Nothing installed on developer machines
- No screen capture: We never see what's on your developers' screens
- No activity monitoring: No mouse tracking, no keystroke logging
- No code content: We see that a file changed, not what the code says
- No communication monitoring: No Slack scanning, no email analysis
- No calendar mining: We don't track meetings or "available time"
📊How to See This in CodePulse
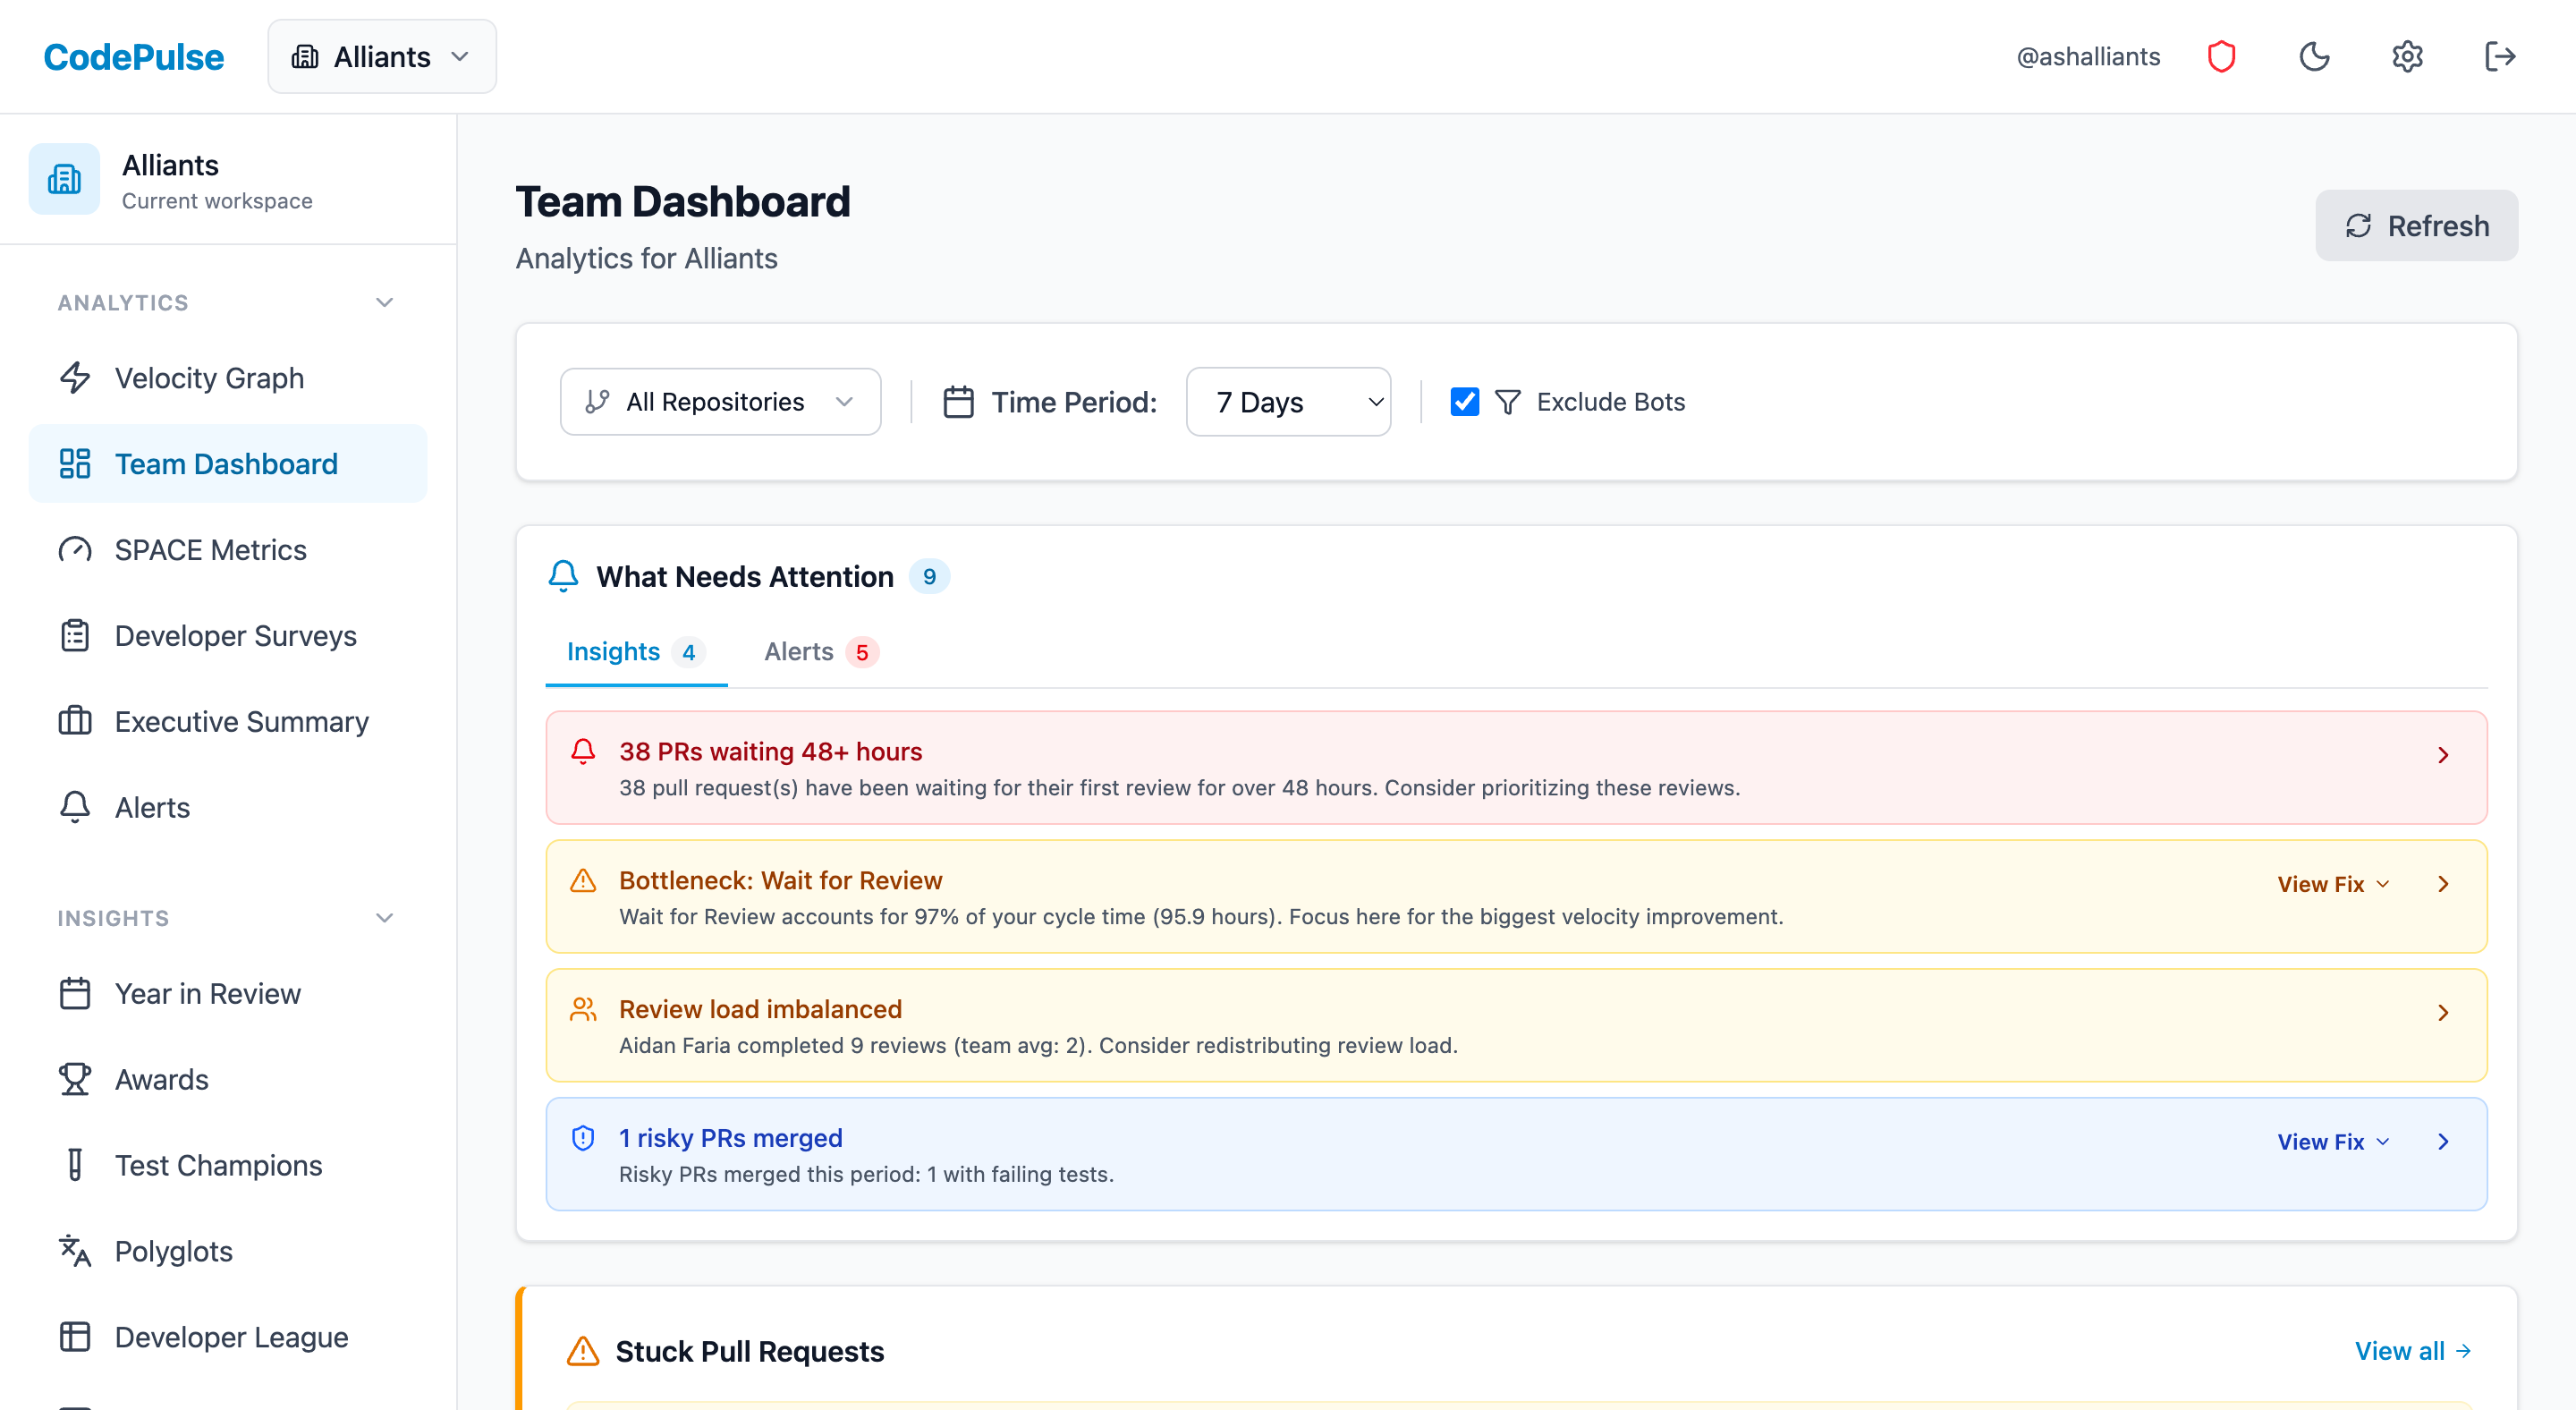
CodePulse shows team health through privacy-respecting metrics:
- Dashboard - Team-level velocity and quality metrics
- Review Network - Collaboration patterns without surveillance
- File Hotspots - Code health from Git history, not screen recording
- Knowledge Silos - Bus factor analysis using commit attribution
- Everyone sees the same data - no hidden manager dashboards
Our Commitments
🔥 Our Take
We will never add surveillance features, even if customers ask for them.
Some customers have requested keystroke tracking, screen capture, and "activity scores." We say no. Every time. Not because we can't build it - because we won't. The engineering analytics industry has done enough damage with surveillance-as-a-service. We're building the alternative: measurement that makes teams better without treating developers like suspects. If you want surveillance, we're not your tool. We're okay with that.
How Do You Find Team Bottlenecks Without Surveillance?
Most "bottleneck detection" tools solve the wrong problem. They watch individuals - keystrokes, active windows, idle time - to guess who's slow. That's surveillance dressed up as diagnostics, and it identifies people instead of the system that's actually failing them. Non-invasive bottleneck detection works at the team level: it looks at how work moves through your pipeline, not how any one developer spends their day.
The signals that matter are all visible in Git and pull request history without touching a single screen. Review wait time - the gap between a PR opening and its first review - exposes reviewer capacity problems long before anyone complains about slow turnaround. Stuck PRs - work sitting open for days with no review activity or unresolved change requests - point to queue depth issues, not individual slowness. Cycle-time phase analysis, which breaks a PR's lifecycle into coding, waiting-for-review, in-review, and merge phases, shows exactly where time accumulates across the whole team, so you can fix the phase that's actually broken instead of telling someone to "move faster."
This distinction between team-health signals and individual tracking holds up under research, not just gut instinct. A 2024 study in Communications Psychology found that people monitored by algorithmic systems perceived significantly less autonomy and showed greater intent to resist than those monitored by humans, unless the monitoring was explicitly framed as developmental rather than evaluative (Schlund & Zitek, 2024). Bottleneck detection framed around fixing the pipeline, not judging the people in it, avoids that resistance entirely because there's nothing evaluative about a queue-depth chart.
🔥 Our Take
If you're using individual developer metrics for performance reviews, you've already lost.
You'll get exactly what you measure: gamed numbers and eroded trust. The moment you compare Alice's cycle time to Bob's, you've turned teammates into competitors. Metrics are for understanding systems, not judging people - performance reviews should use metrics as conversation starters, not scorecards. Bottleneck detection should point at the pipeline, never at a name.
Frequently Asked Questions
Tools that read system-of-record data (Git, PRs, deployments) rather than watching people: CodePulse (GitHub-native cycle time phases, review networks, knowledge silos - individual views exist only for debugging, never ranking), Swarmia (team-level flow metrics with working agreements), and Sleuth (deploy-centric DORA). The test is simple: if a tool needs an agent on the laptop, screenshots, or activity tracking, it is surveillance. If it reads the same Git metadata your team already produces, it can find the bottleneck - the slow review stage, the overloaded reviewer, the single-owner hotspot - without monitoring anyone.
Taking the Privacy-First Path
Non-invasive engineering analytics isn't about accepting less information - it's about focusing on the information that actually matters. Surveillance tools generate mountains of data that tell you nothing about whether your team is building the right things well. Privacy-first analytics gives you signal instead of noise.
The choice you make here defines your engineering culture. Organizations that surveil their developers signal distrust and attract people who tolerate being watched. Organizations that measure outcomes and respect privacy signal maturity and attract people who want to do great work.
For related guidance on ethical measurement, see our guides on building trust with engineering metrics, measuring without micromanaging, and detecting burnout signals from Git data.
Get this view for your own teams
Connect GitHub for team-level workload, review distribution, and delivery signals. Individual views stay off unless your organisation explicitly turns them on.
Read-only GitHub · Your code stays yours · Team-level by default · No credit card
See These Features in Action
Board-ready engineering performance in a single page.
Compare contribution patterns for coaching, not surveillance.
Related Guides
How to Measure Developers Without Becoming the Villain
Learn how to implement engineering metrics that developers actually trust, focusing on insight over surveillance and team-level patterns.
Engineering Metrics That Won't Get You Reported to HR
An opinionated guide to implementing engineering metrics that build trust. Includes the Visibility Bias Framework, practical do/don't guidance, and a 30-day action plan.
Your Git Data Predicts Burnout 6 Weeks in Advance
Use the STRAIN Score framework to detect developer burnout from Git data. Identify after-hours patterns, review overload, and intensity creep before they cause turnover.
Quantitative Developer Experience Data: Measure DevEx Without Surveys
Move beyond surveys to measure developer experience with behavioral data. Learn the 7 quantitative DevEx metrics you can track automatically from git.