
Compare the finished analysis before you choose a platform
See the report CodePulse produces from read-only GitHub workflow data, or connect your own repositories and evaluate the fit with real evidence.
Read-only GitHub · Your code stays yours · Team-level by default · No credit card
An integration that exists is not the same as an integration that works. Most developer productivity platforms list Jira support, but only a few model Jira projects, custom fields, and sprint hierarchies. The gap between "we have an integration" and "our integration is native" is where most platform comparisons go wrong, and where buyers discover six months in that the dashboards they paid for cannot answer the questions they bought the tool to answer.
This guide compares 9 developer productivity platforms across 10 source systems: GitHub, GitLab, Bitbucket, Azure DevOps, Jira, Linear, Asana, Slack, Microsoft Teams, and PagerDuty. We introduce a framework called the Integration Depth Spectrum to separate surface-level connectors from native integrations, then map every platform against every source system in a single matrix you can screenshot for your evaluation deck. According to the DORA State of DevOps Report, integration friction is one of the top reasons engineering tooling investments fail to deliver expected returns.
Which developer productivity platform has the best integrations with your stack?
For GitHub-only teams, CodePulse, Swarmia, and LinearB offer the deepest native PR analytics. For Azure DevOps environments, CodePulse, Jellyfish, and Faros AI are the only platforms with first-class ADO support. For deep Jira portfolio modeling, LinearB, Jellyfish, Plandek, and Faros AI lead the field. For Slack-first organizations, CodePulse, LinearB, Swarmia, and Sleuth deliver native webhook notifications. No platform integrates equally well with everything. Pick based on the systems your team already lives in, then verify integration depth in a live demo before signing.
Why Do Integrations Matter More Than Features?
Features get scored on spec sheets. Integrations get scored after the product is live. The difference is that a missing feature is visible during evaluation, while a shallow integration only reveals itself when an engineering manager tries to drill from a cycle time chart to the actual Jira ticket that caused the bottleneck and finds the link is just the ticket key in plain text.
Buyers consistently underweight integration depth during evaluation. The demo shows a beautiful dashboard with Jira tickets, Slack notifications, and GitHub PRs. What the demo does not show is whether the Jira data refreshes faster than every 24 hours, whether the Slack notification has an interactive approve button, and whether the GitHub integration captures status checks and review threads or only PR metadata. Three months in, the team discovers the integration is read-only and rebuilds parts of the workflow on top of webhooks they thought the platform handled.
The Integration Depth Spectrum
Every integration sits on a three-tier spectrum. Vendor marketing collapses all three into a single "Integrates with" logo grid. The reality is that a Surface-tier integration and a Native-tier integration are different products built on top of the same auth handshake.
OAuth handshake plus read-only API polling. Data refreshes slowly. No writes, webhooks, or two-way sync. Good enough for a dashboard, useless for workflow.
Reads plus writes for common actions, webhook ingestion for near-real-time freshness, and basic custom field support. Sufficient for notifications, alerts, and most dashboards.
Custom field mapping, hierarchy modeling, two-way sync, interactive notifications, and full historical backfill. The integration behaves as if it were a built-in feature of the source system.
When a vendor says "we integrate with Jira," the only useful follow-up is "at which tier?" A Tier 1 Jira integration matches issue keys in PR titles. A Tier 3 Jira integration models projects, custom fields, sprints, and portfolios as first-class objects you can roll up across business units.
"Integration depth is the silent feature of every productivity platform comparison - and the one that gets you fired for choosing wrong."
Which Platforms Support Which Source Code Hosts?
Source code integration is the foundation. If the platform cannot ingest your Git data at the right depth, every downstream metric is approximate. The four main source code hosts in enterprise environments are GitHub, GitLab, Bitbucket, and Azure DevOps Repos. Coverage across the 9 platforms varies more than the marketing pages suggest.
GitHub is universal. Every platform in the comparison supports GitHub because GitHub is the largest source code host and most platforms started with GitHub first. The differentiator is depth. CodePulse, LinearB, Swarmia, and Jellyfish use GitHub App authentication with GraphQL queries that capture PRs, reviews, status checks, timelines, and file diffs in a single round trip. Sleuth focuses narrowly on deployments, so its GitHub integration is intentionally lighter. Cortex models services rather than delivery, so its GitHub integration is about catalog ownership rather than PR analytics.
GitLab has a smaller installed base, which means fewer platforms have invested in deep coverage. LinearB, Jellyfish, Faros AI, and Plandek treat GitLab as a first-class connector with merge request analytics, pipeline data, and label sync. Swarmia, DX, Cortex, and Sleuth offer GitLab support at varying depths. CodePulse does not currently support GitLab as a native connector. For GitLab-centric organizations, verify integration depth in a live demo before any other comparison criteria.
Bitbucket coverage is the weakest across the category. Only Jellyfish, Faros AI, and Plandek offer Bitbucket Cloud support that approaches native depth. LinearB supports Bitbucket at a basic level. CodePulse, Swarmia, Sleuth, Cortex, and DX do not ship native Bitbucket connectors. If you run on Bitbucket and want serious developer productivity analytics, the shortlist is short.
Azure DevOps Repos is the integration most platforms quietly under-deliver on. ADO has a less consistent API surface than GitHub, no "updated-since" filter on pull requests, and a different model for branches, policies, and pipelines. CodePulse, Jellyfish, and Faros AI ship native ADO support with PR analytics, work item linkage, and pipeline events. Plandek covers ADO at the same depth. LinearB supports ADO at a functional level. Swarmia, Sleuth, Cortex, and DX either lack ADO support or handle it as a secondary connector. For Microsoft-centric stacks, ADO integration depth is the most important single criterion in the comparison. If you are still deciding which tracker that stack should centre on, our Azure DevOps vs Jira comparison covers the planning-layer trade-off that sits upstream of this one.
Which Platforms Integrate with Jira, Linear, and Asana?
Project management integration is where the Surface versus Native distinction matters most. Every platform claims to integrate with Jira. Very few model Jira as a first-class data source rather than a label lookup.
Jira is the most common project management system in enterprise engineering. LinearB, Jellyfish, Plandek, and Faros AI fall in the Native tier. They model Jira projects, custom fields, sprint hierarchies, epics, and portfolios. You can roll a delivery metric from individual ticket up to portfolio and compare across business units. CodePulse syncs Jira projects, issue states, and developer assignments with regex-based project detection and per-project watermarks for incremental sync. Swarmia handles Jira ticket linkage cleanly at the Functional tier but does not model portfolios. Sleuth, Cortex, and DX rely on key-matching only, which is fine for dashboards but insufficient for portfolio-level reporting.
Linear is increasingly common in modern startups and mid-market engineering orgs. CodePulse and LinearB ship native Linear integrations with issue sync, cycle tracking, and developer mapping. Swarmia, Jellyfish, and Plandek support Linear at the Functional tier. DX and Cortex have lighter Linear coverage focused on identity rather than delivery. Faros AI exposes Linear as a configurable connector. Sleuth is focused on deployment events, so Linear coverage is intentionally light.
Asana is rarely the primary project management system in engineering orgs but appears in cross-functional product teams. Jellyfish, Plandek, and Faros AI handle Asana at the Functional tier. Most other platforms either treat Asana as out-of-scope or rely on Zapier for synchronization. If Asana is your primary engineering ticketing system, the platform list narrows quickly.
For a feature-by-feature view of how platforms handle metrics on top of these integrations, see our best developer productivity platforms guide. For a complementary view on how platforms scale across team sizes, see our scalable developer productivity software comparison.
Slack, MS Teams, and Notification Integrations Compared
Notification quality is one of the most underrated parts of a developer productivity platform. The right alert delivered to the right channel at the right time changes behavior. The wrong alert, or the right alert delivered as a once-a-day email digest, gets ignored within two weeks.
Slack support is universal at the Functional tier or higher. CodePulse, LinearB, Swarmia, and Sleuth deliver native Slack notifications with formatted attachments, threading, and interactive buttons for actions like acknowledging an alert or assigning a reviewer. Jellyfish, Plandek, and Faros AI ship Functional-tier Slack support with formatted messages but limited interactivity. DX uses Slack mainly to distribute survey prompts. Cortex uses Slack to surface service ownership questions. Sleuth and PagerDuty integrations make Sleuth particularly strong for incident-adjacent Slack workflows.
Microsoft Teams is the gap. Many engineering orgs at large enterprises run on Teams rather than Slack, and the integration coverage is uneven. CodePulse, Jellyfish, and Plandek support Teams natively with webhook delivery and formatted cards. Faros AI supports Teams as a configurable webhook target. LinearB and Swarmia have Teams coverage at a functional level. Sleuth, Cortex, and DX have either limited Teams support or roadmap items. For Microsoft-heavy enterprises, Teams integration depth is a hard requirement that eliminates several otherwise capable platforms.
The signal to watch during evaluation is interactivity. Surface-tier notifications send a link and stop. Native-tier notifications include action buttons, threaded follow-ups, and bidirectional updates so that acknowledging an alert in Slack updates the platform without a context switch.
CI/CD, Observability, and Incident Management Integrations
The boundary of a developer productivity platform stops at the source code repo for some vendors and extends through production observability for others. The integrations that matter here are CI/CD pipelines (GitHub Actions, GitLab CI, CircleCI, Jenkins, Azure Pipelines), observability platforms (Datadog, New Relic, Honeycomb), and incident management systems (PagerDuty, Opsgenie, Statuspage).
CI/CD coverage tracks closely with source code coverage because pipeline data lives next to the source repo. CodePulse ingests GitHub Actions and Azure Pipelines events for build success rates, deploy frequency, and pipeline durations. Sleuth was purpose-built around deployment events and supports the widest range of CI/CD targets including custom webhook deployments. Faros AI treats CI/CD as a normalized event stream in its warehouse. Jellyfish and Plandek aggregate CI/CD events into their delivery dashboards. LinearB and Swarmia surface CI/CD events at the PR level. Cortex focuses on service ownership rather than CI/CD. DX is survey-centric and does not deeply ingest CI/CD events.
Observability integration is rarer and usually optional. Sleuth ingests deploy markers from Datadog and similar platforms to correlate deploys with incident spikes. Faros AI exposes observability data as another warehouse table. Cortex pulls service health from Datadog into its catalog. Jellyfish, Plandek, and DX have limited observability integration. CodePulse, LinearB, and Swarmia focus on git and ticket data rather than production telemetry, which is a deliberate scope choice.
Incident management integration matters for teams that want to measure Change Failure Rate and Mean Time to Recovery. PagerDuty is the most common target. Sleuth, Faros AI, Jellyfish, and Plandek integrate with PagerDuty at the Functional or Native tier for incident timestamps and impact data. Cortex correlates PagerDuty incidents with service ownership for on-call routing. CodePulse does not currently ingest PagerDuty as a native connector, which is a deliberate scope choice that keeps the product focused on git-derived signals rather than production incidents. For Change Failure Rate, see our best DORA metrics tools guide.
| Platform | GitHub | GitLab | Bitbucket | Azure DevOps | Jira | Linear | Asana | Slack | MS Teams | PagerDuty |
|---|---|---|---|---|---|---|---|---|---|---|
| CodePulse | Native | Planned | Not supported | Native | Native | Native | Not supported | Native | Functional | Not supported |
| LinearB | Native | Native | Functional | Functional | Native | Native | Via API | Native | Functional | Functional |
| Jellyfish | Native | Native | Native | Native | Native | Functional | Functional | Functional | Native | Functional |
| Swarmia | Native | Functional | Not supported | Functional | Functional | Functional | Not supported | Native | Functional | Not supported |
| DX | Functional | Functional | Not supported | Via API | Via API | Via API | Not supported | Native | Functional | Not supported |
| Faros AI | Native | Native | Native | Native | Native | Functional | Functional | Functional | Functional | Native |
| Cortex | Functional | Functional | Functional | Functional | Functional | Via API | Not supported | Native | Functional | Native |
| Sleuth | Functional | Functional | Functional | Via API | Functional | Via API | Not supported | Native | Via API | Native |
| Plandek | Native | Native | Native | Native | Native | Functional | Functional | Functional | Native | Functional |
Tiers: Native = custom field mapping, two-way sync, full backfill. Functional = reads, writes, webhook ingestion. Via API = auth handshake plus basic read-only polling. Not supported = no first-party connector. Verify current state in a live vendor demo before signing.
"Every vendor claims Jira integration. Four model Jira properly. The other five match issue keys and call it support."
Our Take
Every vendor claims Jira integration. Only LinearB and Jellyfish actually model Jira's project hierarchy. Everyone else just reads issue keys.
The same pattern repeats across every source system in this comparison. A logo on a marketing page is not the same as a native integration. Native integrations cost engineering effort to build and engineering effort to maintain. Vendors who under-invest in integration depth ship pretty dashboards backed by shallow data, which is exactly the combination that loses customers at renewal. Treat the integration matrix as a hard filter. If a platform sits in the Surface tier for the systems your team lives in, remove it from the shortlist before anything else.
How Do You Evaluate Integration Quality (Not Just Existence)?
Vendor evaluation matrices treat integrations as boolean. The platform either integrates with Jira or it does not. The reality is a spectrum, and the only way to verify which tier a platform sits in is to test it directly. Use these five questions during evaluation and require the vendor to demonstrate the answer on screen.
- Connect a fresh instance to our actual stack. Not a sandbox, not a pre-populated demo org. A live walkthrough that auths against your GitHub, Jira, and Slack. If the vendor refuses, the integration is shallower than the marketing implies.
- Show me which fields you write back versus only read. A two-way sync changes the workflow. Read-only integrations are dashboards, not workflow tools. Ask for the exact list of write operations supported per system.
- What is the median lag between an event in the source and an update in your platform? Native integrations answer in minutes via webhook delivery. Surface integrations answer in hours or change the subject to nightly batch refresh.
- How do you handle custom fields and hierarchies? For Jira, ask specifically about epics, custom fields, sprint groupings, and portfolios. For Azure DevOps, ask about iteration paths and work item types. If the answer is "we flatten everything to tags," the platform was built for small teams.
- Show me a customer using the same integration combination as ours. A customer reference call with their VP Engineering matters more than a feature list. If the vendor cannot produce a reference, the integration combination has not been stress-tested.
How to See This in CodePulse
CodePulse exposes its full integration surface in a single place so you can verify depth before committing:
- The Integrations page shows GitHub App, Azure DevOps, Jira, Linear, and Slack connectors with live status indicators and per-connector configuration
- Watermark-based incremental sync runs every 15 minutes per connector, so dashboard freshness lag stays in single-digit minutes for active repositories
- Slack notifications include interactive elements for review SLA breaches and engineering health alerts, not just plain links to dashboards
- Jira sync handles project-level watermarks and regex-based ticket detection in PR titles, branches, and commit messages
For broader context on choosing a productivity platform, our engineering analytics tools comparison ranks platforms by feature depth across the full category. For DORA-specific tooling decisions where deployment and incident integrations matter most, our best DORA metrics tools guide breaks down the platforms purpose-built for DORA reporting.
The Integration Depth Spectrum is a filter, not a verdict. Once you know which systems your team lives in and which tier of integration depth you actually need, the shortlist gets short fast. For GitHub-heavy and Azure DevOps-heavy organizations who want native Jira, Linear, and Slack connectors with predictable pricing, CodePulse covers the most common combinations cleanly. For deep Bitbucket coverage or full PagerDuty incident modeling, Jellyfish, Faros AI, or Plandek are honest recommendations despite the enterprise contract size.
Frequently Asked Questions
CodePulse, LinearB, Swarmia, and Jellyfish all use GitHub App authentication with GraphQL pagination, which gives them access to PR timelines, review threads, status checks, file-level diffs, and webhook events. CodePulse and Swarmia surface PR review networks and file ownership from the same payload, which simpler integrations skip. Sleuth focuses on deployment events rather than PR analytics, so its GitHub integration is intentionally narrower. If you need everything a GitHub Enterprise admin would consider native, the shortlist is CodePulse, LinearB, Swarmia, and Jellyfish.
Related Guides
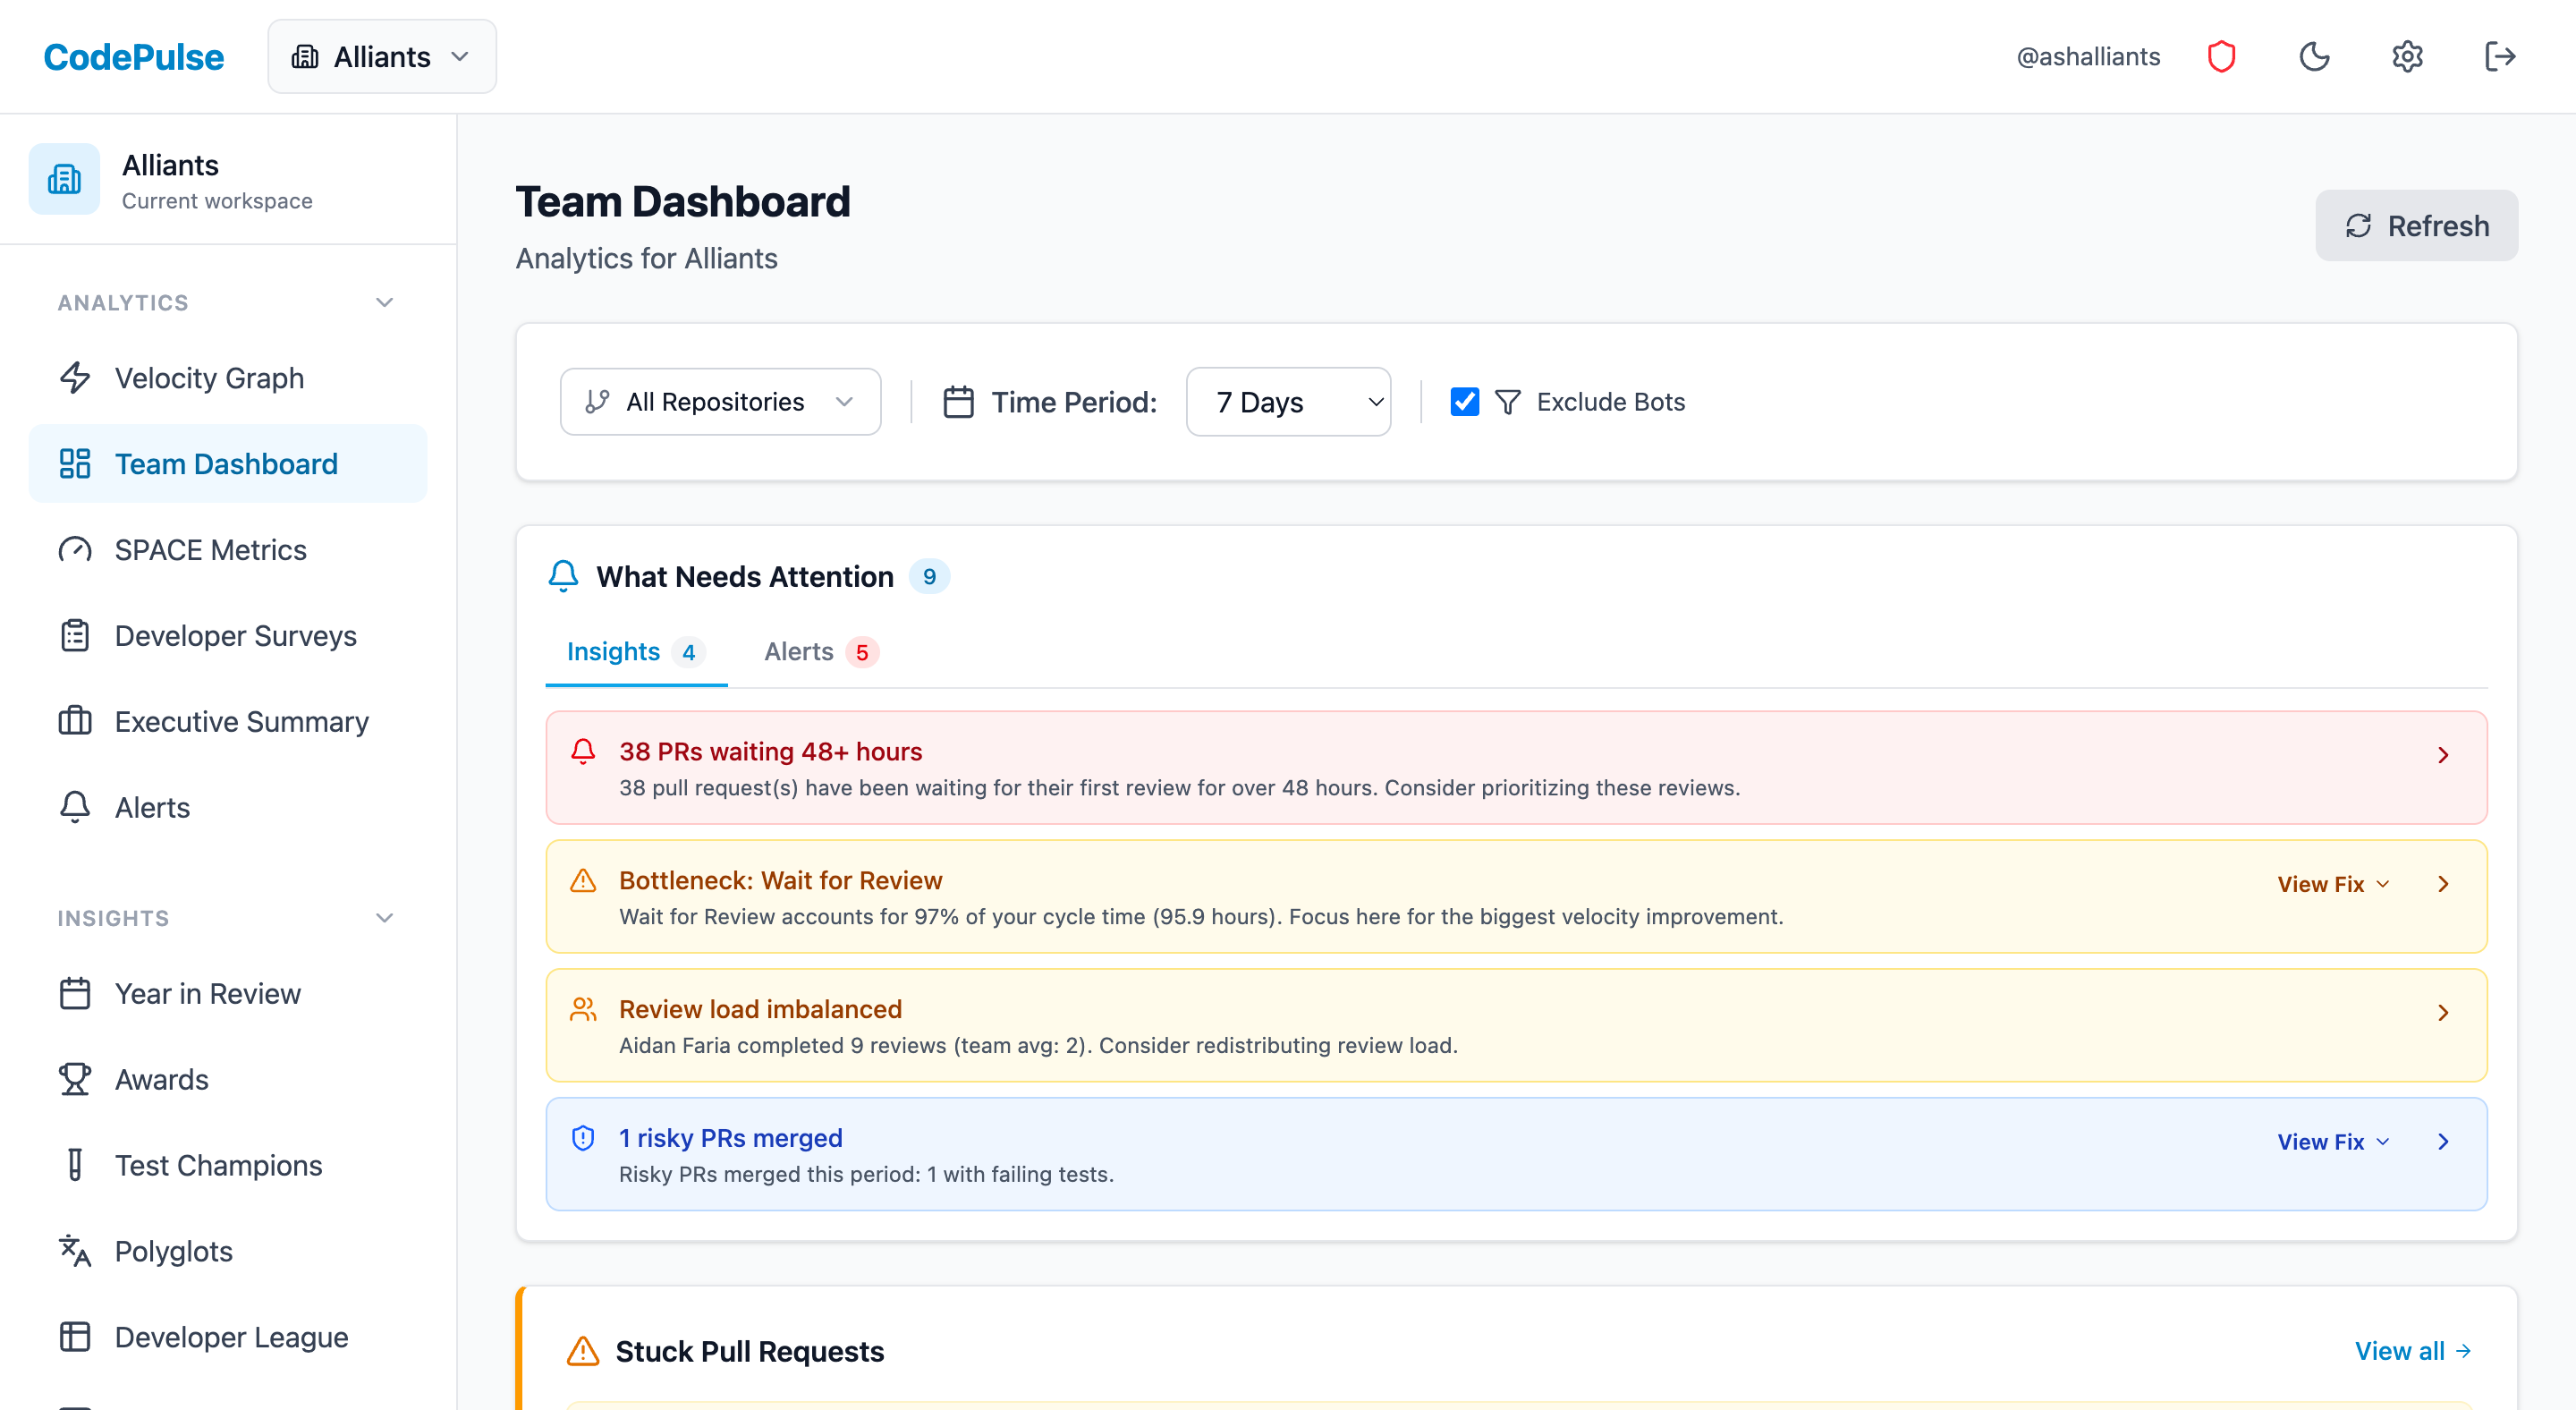
Evaluate CodePulse against your own delivery history
A comparison table only goes so far. Connect read-only GitHub in about five minutes and judge the output on your repositories, at one flat price, with no per-seat math.
Read-only GitHub · Your code stays yours · Team-level by default · No credit card
See These Features in Action
Explore all featuresRelated Guides
Best Developer Productivity Platforms for 2026 (Ranked)
We ranked 9 developer productivity platforms across analytics, DX surveys, internal portals, and workflow automation. Honest positioning, real pricing, and a decision matrix to match the right tool to your problem.
Scalable Developer Productivity Software (2026)
Which developer productivity platforms scale to 500+ engineers without breaking budgets. Data limits, org modeling, and pricing-at-scale compared across 9 platforms.
Jellyfish vs LinearB vs Swarmia: Full 2026 Comparison
Compare Jellyfish, LinearB, Swarmia, Allstacks, Haystack and more engineering analytics tools. Features, pricing, cycle time benchmarks, and integrations.
Best DORA Metrics Tools for 2026: 8 Platforms Compared
An opinionated comparison of the 8 best tools for automated DORA metrics reporting, ranked by automation depth, setup speed, metric accuracy, pricing transparency, and real-world usefulness for engineering leaders.