See these metrics for your own team
CodePulse turns your GitHub history into engineering insights in about 5 minutes. Free to start, no credit card.
Get started freePerformance reviews are the most stressful time of the year. For managers, it's a memory test. For engineers, it's a lottery. But it doesn't have to be. By using data to recall 6 months of work, you can eliminate recency bias, recognize the invisible "glue work" that holds the team together, and have conversations grounded in reality instead of impressions. The catch? Do it wrong, and you'll create a surveillance culture that destroys everything you're trying to build.
"The goal of data in performance reviews isn't to judge people more accurately. It's to have better conversations about growth, impact, and what's actually happening."
The Trust Problem: Why Developers Fear Metrics in Reviews
Before we discuss how to use data in performance reviews, we need to address the elephant in the room: developers don't trust metrics-based reviews. And they're often right not to.
According to the 2024 Stack Overflow Developer Survey, 80% of developers report being unhappy at work, with burnout and unrealistic expectations being top contributors. A significant driver? The feeling that their work isn't understood or fairly evaluated.
Here's what creates that distrust:
- Weaponized metrics: "Your commit count is below average" as a negative talking point.
- Context-free comparisons: Comparing a senior architect's output to a feature developer's.
- Gaming becomes rational: When metrics matter, people optimize for metrics, not outcomes.
- Invisible work disappears: Mentoring, architecture, firefighting don't show up in dashboards.
- Selection bias: The metrics you choose reveal what you value. Choose wrong and you've told your team what to ignore.
🔥 Our Take
If you're using individual developer metrics for performance reviews, you've already lost. You'll get exactly what you measure: gamed numbers and eroded trust. The moment you compare Alice's cycle time to Bob's, you've turned teammates into competitors.
Metrics should be conversation starters, not scorecards. Use them to understand patterns and open dialogues, never as the final word on someone's performance. The best performance conversations happen when data illuminates what to discuss, not what to conclude.
The Recency Bias Problem
The human brain is terrible at remembering what happened 5 months ago. We naturally over-index on:
- Recency: What happened in the last 4 weeks.
- Visibility: Who talked the most in Slack/meetings.
- Catastrophe: Who caused (or fixed) the big outage.
- Similarity: People who remind us of ourselves.
This punishes the "quiet consistent" engineer who shipped reliable code every week for 24 weeks but never made a scene. It rewards the firefighter who creates fires to put out. It disadvantages remote workers, introverts, and anyone whose best work happens in code, not meetings.
"'High performer' is often just 'most visible.' That developer with the most commits? They might just be breaking work into tiny pieces. The one with the fastest cycle time? They might be cherry-picking easy tasks."
This is where data helps, but only if used correctly. Data can surface the contributions you've forgotten, the patterns you've missed, and the work that happened before the "recent" events that dominate your memory.
What Data CAN Tell You
Used correctly, engineering data provides valuable signals. Here's what you can legitimately learn:
Patterns Over Time
Data excels at showing longitudinal patterns that humans miss:
- Consistency: Did they ship regularly, or in bursts followed by silence?
- Growth trajectory: Are their PRs getting more complex? Are they reviewing more senior work?
- Collaboration changes: Did they expand their network? Take on new reviewers?
- Scope expansion: Are they working in more repositories? Different parts of the codebase?
Collaboration Signals
Some of the most valuable work is invisible in individual metrics but visible in relationship data:
- Review network centrality: Who is frequently sought out for reviews?
- Unblocking others: Whose reviews have the fastest turnaround?
- Knowledge distribution: Who reviews across multiple repositories vs. staying in one lane?
- Mentorship signals: Who reviews junior developers' work most often?
Context for Anomalies
When something looks "off," data can provide context:
- Low output period: Was it during a major refactor? Infrastructure migration? Team onboarding?
- High churn: Was it an experimental feature that got redesigned?
- Reduced reviews: Were they heads-down on a critical project?
What Data CANNOT Tell You
This is critical. Data has significant blind spots, and pretending otherwise destroys trust.
🔥 Our Take
The most important engineering work is unmeasurable: architecture decisions that prevented problems, mentorship that made someone better, documentation that saved hours of confusion. If you only track what's countable, you'll undervalue what matters.
Every metric captures a shadow of reality, not reality itself. Acknowledge this openly with your team. When they see you understand the limits, they'll trust you more with the data you do use.
| What Metrics Miss | Why It Matters |
|---|---|
| Quality of decisions | Choosing NOT to build something is invisible but often the highest-value work. |
| Mentorship impact | The time spent in 1:1s, pairing, and coaching doesn't show in Git logs. |
| Architecture thinking | Design docs, RFC reviews, system thinking happens before code. |
| Psychological safety creation | The person who makes others feel safe to ask questions is invaluable. |
| Cross-team coordination | Meetings, alignment sessions, stakeholder management happen offline. |
| Problem prevention | You can't count bugs that never existed due to good design. |
Quantifying "Invisible" Glue Work
"Glue work" is the technical leadership that makes others better but doesn't show up in a feature demo. It is often performed by senior engineers, and research shows it's disproportionately performed by women and underrepresented groups, then undervalued in reviews.
"If you don't intentionally look for glue work, you'll systematically undervalue your most important team members while over-rewarding the loudest ones."
You can partially surface glue work with data. Here's what to look for:
| Glue Activity | Metric Signal | Where to Look |
|---|---|---|
| Unblocking Others | High Reviews Given, low review turnaround time | Developer Profiles |
| Mentorship | Edges to junior developers in review network | Review Network |
| Knowledge Spreading | Reviews across multiple repositories | Developer Profiles |
| Maintenance Work | Work in legacy or high-churn files | File Hotspots |
| Quality Gatekeeping | Thorough review comments, suggestion acceptance rate | Review Insights |
Free Download: Performance Review Prep Worksheet (Interactive) | PDF - A data-backed contribution summary template for engineers preparing for their reviews.
The Conversation Framework: How to Discuss Data Without Weaponizing It
The difference between helpful data and surveillance culture is entirely in how you use it. Here's a framework for data-informed conversations:
The FAIR Framework for Data-Backed Reviews
| Step | What It Means | Example |
|---|---|---|
| Facts First | Present the data neutrally, without judgment attached | "I see you merged 12 PRs this quarter, down from 18 last quarter." |
| Ask for Context | Invite the person to explain what you might not see | "What was happening for you during that time?" |
| Interpret Together | Make sense of the data collaboratively | "So the migration work was more complex than expected. That makes sense." |
| Refine the Narrative | Update your understanding based on the conversation | "I'll note that the reduced PR count reflects a strategic infrastructure investment." |
Do This, Not That
| Don't Say | Say Instead | Why |
|---|---|---|
| "Your commit count is below team average." | "I noticed a different pattern in Q2. What were you focused on?" | Opens dialogue instead of accusation |
| "Alex ships twice as many PRs as you." | "Let's talk about the scope and complexity of your work this quarter." | Acknowledges work varies; avoids toxic comparison |
| "The data shows you're underperforming." | "This data is a starting point. Help me understand the full picture." | Positions data as incomplete, invites partnership |
| "You need to increase your review throughput." | "I see you're doing fewer reviews than last quarter. Is something blocking you?" | Assumes good intent; seeks blockers, not blame |
Red Flags vs Context: When Numbers Mean Something
Sometimes low numbers signal a real problem. Sometimes they're completely reasonable. Here's how to tell the difference:
When Low Numbers Might Signal a Problem
- Consistent decline over multiple quarters without external explanation (team change, role change, project type).
- Pattern mismatch: Someone in a feature development role with very low PR output AND low review activity AND no major project to show for it.
- Isolation signals: Decreasing collaboration (fewer reviews both given and received), withdrawal from team processes.
- Quality indicators: High revert rate, increasing churn on their code, PRs that sit unreviewed (suggesting reviewers avoid them).
When Low Numbers Are Probably Fine
- Role-appropriate: Tech leads, architects, and senior ICs often have lower individual output but higher leverage.
- Project phase: Discovery, design, research phases produce less code but more value.
- High complexity: A few PRs that represent major infrastructure changes vs. many small feature PRs.
- Team support: Someone doing heavy mentoring/onboarding will have reduced personal output.
- Life circumstances: Illness, family situations, burnout recovery are real and valid.
The Gaming Problem
When people know they're measured on metrics, they optimize for metrics. This isn't malicious; it's rational.
- Commit inflation: Breaking work into tiny commits to increase counts.
- Easy work selection: Cherry-picking simple tasks to inflate throughput.
- Rubber-stamp reviews: Fast but shallow reviews to boost "reviews given" count.
- Avoiding hard problems: Complex, risky work has lower measurable output.
The solution: Don't tie compensation or promotion directly to metrics. Use metrics to inform conversations, not replace judgment. Make this policy explicit, and stick to it.
Alternative Approaches: Beyond Metrics
Data should be one input, not the only input. Here are complementary approaches:
1. Peer Feedback (Done Right)
Ask specific, behavior-based questions:
- "Describe a time Sarah helped you solve a problem."
- "What does Carlos do that makes the team better?"
- "If you were stuck on a complex issue, who would you ask for help? Why?"
Avoid: "Rate Sarah on a scale of 1-5 for teamwork." This produces meaningless data.
2. Impact Narratives
Ask each person to write their own "impact narrative" covering:
- The 3 most significant things they contributed this cycle.
- How they made others more effective.
- A problem they prevented or solved early.
- Something they learned or an area they grew in.
Then compare their narrative to the data. The gaps are the interesting conversation.
3. The "What Would We Lose?" Test
Ask yourself: "If this person left tomorrow, what specific capabilities would we lose?" If you can't articulate concrete, unique value, either you don't know them well enough, or there's a real conversation to have.
How to Audit 6 Months of Work Manually
Even without dedicated tools, you can reduce recency bias with a simple audit process:
- Scan Closed PRs: Go to their PR list. Scroll to 6 months ago. Read 1 in every 10 titles to remember the "arc" of their work. Note major projects.
- Check Review Comments: Search for their review comments. Are they helpful? Mentoring? Teaching? Or just nitpicking style?
- Look for "Assists": Search for @ mentions. Who tagged them for help? Being frequently consulted is a strong signal of influence.
- Check PR Review Requests: Who requested their review most often? This shows who trusts their judgment.
- Note Unusual Patterns: Any month with significantly different activity? Note it and ask about it in the review.
Quick GitHub Audit Checklist
For Each Direct Report
- Review their PR list from 6 months ago to now
- Note 3-5 significant contributions I'd forgotten
- Check their review comment quality (helpful vs nitpicky)
- See who @mentions them most (influence signal)
- Note any unusual low/high periods to discuss
- Review their team chat contributions (if applicable)
- Ask 2-3 peers for specific feedback
Document
- Forgotten contributions
- Glue work observed
- Questions to discuss
Structuring the Review Document
Use data to support your narrative, not replace it. Here's a template:
"Sarah has been a critical force multiplier for the team this half.

IMPACT SUMMARY:
While her feature output (15 PRs merged) was moderate, her overall impact
was exceptional due to her multiplier effect on the team.

EVIDENCE-BACKED OBSERVATIONS:

1. Unblocking Excellence
   - Performed 45 code reviews (highest on team)
   - Average review turnaround: 4 hours (team avg: 12 hours)
   - Data shows she's the primary reviewer for both new hires

2. Knowledge Distribution
   - Reviewed PRs across 6 different repositories
   - Only person who bridges the frontend and backend teams

3. Quality Contribution
   - Her PRs have 0% revert rate
   - Code churn on her work: 5% (well below 15% team average)

GROWTH AREAS (discussed and agreed):
- Taking on more architectural ownership
- Documenting tribal knowledge she carries

IMPACT NARRATIVE (Sarah's self-assessment aligned):
'I focused on unblocking the team and spreading knowledge this quarter,
which meant less personal feature output. The new hires are now autonomous
on 80% of tasks.'"}
Using CodePulse for Review Preparation
CodePulse can automate much of the manual audit process, giving you 6 months of context instantly.
🏆Developer Profiles & Awards
Get instant context for any team member:
- Visit Developers to see individual profiles with historical data.
- Check Review/Merge Ratio to gauge "giver vs taker" behavior.
- View Awards like "Rapid Reviewer," "Deep Diver," or "Team Player" that highlight work styles.
- Use Review Network to see collaboration patterns and mentorship relationships.
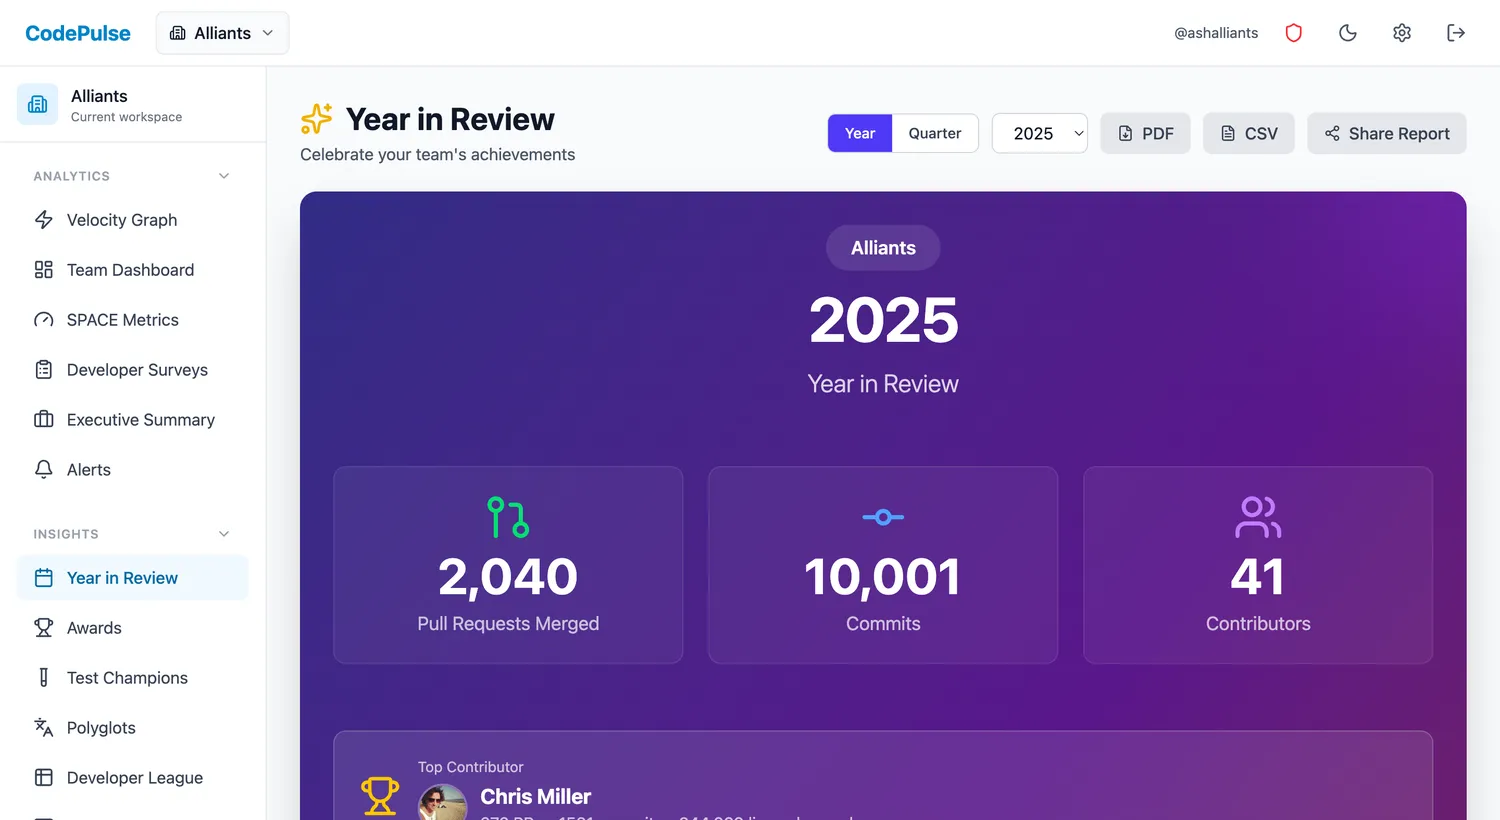
📊Year in Review Export
Generate a comprehensive annual summary:
- Navigate to Year in Review for annual metrics.
- Export individual or team summaries for review documentation.
- See trends over quarters to identify growth and patterns.
Final Principles: Data as a Conversation Starter
Remember these principles when using data in performance reviews:
- Data illuminates; it doesn't conclude. Use it to ask better questions, not to deliver verdicts.
- Context always wins. Any single data point can be explained. Patterns across time are more meaningful.
- Transparency builds trust. Show people the same data you're seeing. No surprises.
- Metrics are team-level tools. Aggregate data helps you improve systems. Individual data starts conversations.
- The goal is growth. If the review doesn't leave someone knowing how to grow, you've failed regardless of how accurate your data was.
"The best performance review is one where the engineer leaves feeling understood, not measured. Data helps you understand. Using it to measure destroys the relationship that makes everything else possible."
Related Resources
Continue learning about fair, effective engineering management:
- The Complete Guide to Measuring Engineer Performance - Framework for thinking about what to measure and why.
- Developer Awards & Recognition - How to celebrate diverse contributions.
- Measuring Team Performance Without Micromanaging - Balancing accountability with autonomy.
- Detecting Burnout Signals in Git Data - Early warning signs to watch for in reviews.
See these insights for your team
CodePulse connects to your GitHub and shows you actionable engineering metrics in minutes. No complex setup required.
Free tier available. No credit card required.
See These Features in Action
Compare contribution patterns for coaching, not surveillance.
Measure review thoroughness and feedback quality across the team.
Related Guides
Engineering Team Management: Using Data to Lead Without Micromanaging
Managing software teams requires balancing delivery, quality, team health, and individual growth. This guide shows how to use data for visibility while avoiding surveillance, with practical scenarios and communication patterns.
The Tech Lead Dashboard Your Manager Shouldn't See
The metrics that matter for tech leads - code quality, technical debt, architecture decisions, and delivery. Different from EM metrics, focused on technical excellence.
Developer Retention: Git Signals That Predict Departure
Burnout shows in data before exit interviews. This guide reveals how to detect flight risk using collaboration patterns, workload metrics, and engagement signals - without surveillance.
Engineering Metrics That Won't Get You Reported to HR
An opinionated guide to implementing engineering metrics that build trust. Includes the Visibility Bias Framework, practical do/don't guidance, and a 30-day action plan.
The 50-Engineer Cliff: Why Everything Breaks After Series B
The definitive guide to engineering metrics for the Series B transition. Learn why Hero Mode breaks at 50 engineers, how to build a tiered metrics stack, what boards actually want to see, and when to hire vs. optimize.
Improve Developer Experience: Proven Strategies
A practical guide to improving developer experience through surveys, team structure, and proven strategies that actually work.