See these metrics for your own team
CodePulse turns your GitHub history into engineering insights in about 5 minutes. Free to start, no credit card.
Get started freeBurnout shows in data before it shows in exit interviews. The signals appear in commit patterns, review behavior, and collaboration metrics 2-3 months before resignation. This guide shows you how to detect flight risk early, understand what actually drives retention, and build systems that keep your best engineers engaged.
Our Take
Burnout is a management failure, not a personal weakness. If your engineers are burning out, you have a system problem - bad workload distribution, poor planning, insufficient tooling, or toxic culture. Treating burnout as an individual problem to be solved with meditation apps is negligence. Treat it as a system problem and fix the system.
The True Cost of Developer Turnover
Before diving into detection metrics, understand what's at stake. Developer turnover isn't just expensive - it's devastating to team momentum and knowledge continuity.
The Turnover Math
Direct Costs
- Recruiting: $4,000-$15,000
- Signing bonus: $10,000-$30,000
- Onboarding: 3-6 months partial productivity
Hidden Costs
- Knowledge loss: priceless domain context
- Team disruption: 17% engagement drop
- Cascade effect: 1 departure → more departures
"Replacing a single employee can cost anywhere from 90% to 200% of their annual salary, when accounting for recruiting, training, lost productivity, and impact on morale. According to Gallup, employee attrition costs U.S. businesses $1 trillion annually."
Tech companies are losing 13-18% of their engineering talent every year. A survey of 7,700+ tech professionals found that one-third had switched jobs in the past two years. The top reasons? Compensation, career development, and more engaging work. 54% cited heavy workloads as a top stressor.
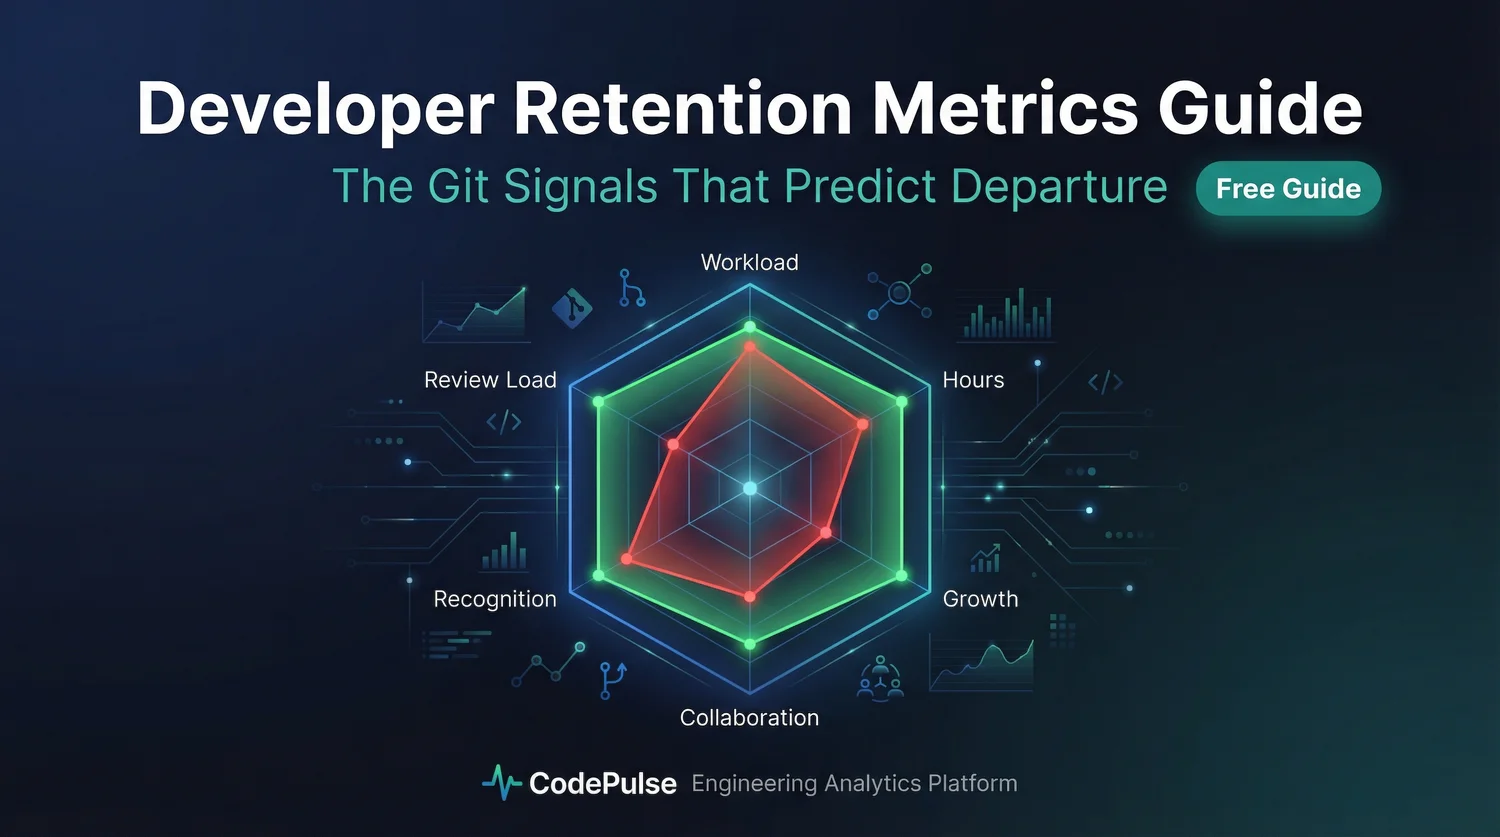
The Retention Risk Radar
Flight risk manifests across multiple dimensions. No single metric predicts departure - you need a holistic view that captures workload, engagement, growth, and recognition patterns.

The Six Dimensions of Flight Risk
1. Workload (PR Volume, LOC/Day)
Risk signal: Sustained high output above team average. Paradoxically, your highest performers are at highest risk. Teams where 80%+ of high-complexity work goes to 2-3 people show 67% higher burnout rates.
2. Working Hours (Off-Hours Commits)
Risk signal: Increased commits during evenings, weekends, or holidays. A shift from business hours to off-hours suggests unsustainable workload or poor boundaries.
3. Growth Opportunities (New Skills, Repos)
Risk signal: Working only in legacy code with no exposure to new technologies. Engineers who see advancement potential are 3x more likely to stay. Employees offered professional development are 53% less likely to seek new jobs.
4. Collaboration Patterns
Risk signal: Reduced cross-team interactions, fewer PR comments, less participation in discussions. Withdrawal from collaboration often precedes departure.
5. Recognition (Reviews Given/Received)
Risk signal: High contribution but low recognition. Engineers whose PRs sit unreviewed or who rarely receive positive feedback feel undervalued.
6. Review Load Balance
Risk signal: Disproportionate review burden. Some engineers become review bottlenecks, spending 40%+ of their time reviewing others' code while their own work stalls.
Git-Based Burnout Signals
Your Git history contains patterns that correlate with burnout and flight risk. While no single metric is conclusive, the combination of signals provides early warning.
| Signal | What to Watch | Risk Indicator |
|---|---|---|
| Commit Time Drift | % of commits outside business hours | >30% off-hours = high risk |
| PR Completion Time | Time from first commit to merge | Increasing trend = stalling |
| Review Response Time | Time to first review comment | Slowing response = disengagement |
| Code Review Depth | Comments per review, approval speed | Rubber-stamping = checked out |
| Collaboration Graph | Number of unique collaborators | Shrinking network = isolation |
| Repo Diversity | Number of repos contributed to | Single-repo focus = stagnation |
"A half-finished PR lingering for 17 days" is a burnout signal. Yet companies still track the wrong numbers - velocity points and commits per day - while missing the behavioral patterns that actually predict departure.
Detect Patterns Before They Become Problems
CodePulse analyzes collaboration patterns, review load distribution, and working-hours trends to help you identify retention risks before they become resignations.
The Anti-Surveillance Approach
Here's the tension: using data to detect burnout can easily become surveillance. The line between "caring for your team" and "monitoring individuals" is thin and easily crossed.
Our Take
Individual-level metrics like "commits per day" or "hours logged" are surveillance tools that create anxiety, not safety. The right approach is team-level pattern detection: "Is our review load balanced?" not "Why did Jane commit at 11pm?" If your retention strategy requires monitoring individual engineers, you've already lost.
Principles for Ethical Retention Monitoring
✅ Team-Level Analysis
- Review load distribution across team
- Aggregate working-hours patterns
- Team velocity trends
- Collaboration density metrics
- Knowledge distribution (bus factor)
❌ Individual Surveillance
- Individual commit counts as KPIs
- Personal "productivity scores"
- Individual time tracking
- Ranking engineers by output
- Using metrics in performance reviews
How to Use Data Responsibly
- Aggregate first: Look at team patterns, not individual behavior. If 40% of your team commits on weekends, that's a team problem, not an individual problem.
- Context matters: A spike in off-hours commits during a critical launch is different from a sustained pattern over months.
- Conversation, not confrontation: Use signals as conversation starters in 1:1s, not as evidence for performance discussions.
- Opt-in transparency: Share the metrics you track with the team. Let engineers see their own data.
- Fix systems, not people: When you identify a problem, fix the process, not the individual.
Proactive Intervention Strategies
Detection is only valuable if it leads to intervention. Here's how to act on retention signals before they become resignations.
Workload Rebalancing
When data shows uneven workload distribution, redistribute before burnout sets in.
Workload Analysis Example:

Team of 6 engineers, last quarter:
Developer A: 45% of all high-complexity PRs
Developer B: 25% of all high-complexity PRs
Developers C-F: 30% combined

Risk: Developer A is doing 1.5x more complex work than
      their fair share. Flight risk: HIGH.

Intervention:
1. Pair Developer A with others on complex work
2. Rotate ownership of critical systems
3. Create explicit complexity budget per engineer
4. Track distribution monthly, intervene at 30%+ imbalance
Review Load Management
Some engineers become bottlenecks for code review, spending hours reviewing while their own work stalls.
Review Load Intervention
- Cap review assignments: No engineer should review more than 30% of team PRs
- Rotate reviewer roles: Spread the load across seniority levels
- Automate initial review: Use linters and CI checks to reduce human review burden
- Time-box reviews: Set expectations for review depth vs. speed
Growth Opportunities
Engineers stuck in legacy code without exposure to new technologies are at elevated flight risk. Create intentional growth paths.
- Rotation programs: Planned exposure to different parts of the stack
- Learning budgets: Time and money for skill development
- Stretch assignments: Pair juniors with seniors on challenging work
- Conference/training: External learning opportunities
Recognition Systems
Engineers who contribute significantly but receive little recognition feel undervalued. Build explicit recognition into your process.
Recognition That Matters
- Helpful reviewer awards: Recognize thorough, educational reviews
- Knowledge-sharing credits: Celebrate documentation and mentoring
- Incident response heroes: Public thanks for firefighting
- Code quality champions: Recognize technical excellence
The Manager Factor
Research consistently shows that manager quality is the strongest predictor of retention. Data shows 21.5% of employees with poor managers plan to leave versus 4.3% with excellent managers - a 5x difference.
"People don't leave companies, they leave managers." This cliché persists because it's true. Manager quality accounts for more variance in retention than compensation, work content, or company culture.
What Good Engineering Managers Do
- Regular 1:1s: Weekly conversations about work, growth, and blockers
- Shield from chaos: Protect team from excessive interruptions and scope changes
- Career advocacy: Active investment in reports' growth and promotion
- Workload awareness: Monitor and rebalance before burnout
- Recognition: Public and private acknowledgment of contributions
Combining Quantitative and Qualitative Data
Git data reveals behavior patterns. Survey data reveals sentiment. The combination is more powerful than either alone.
Monthly Pulse Surveys
Short, frequent surveys capture sentiment trends before they become crises. Recommended questions:
Pulse Survey Questions (Monthly, 5-minute max):

1. How sustainable is your current workload?
   [1-5 scale: Unsustainable → Very Sustainable]

2. How confident are you in the codebase you work in?
   [1-5 scale: Not Confident → Very Confident]

3. How much are you learning and growing?
   [1-5 scale: Not at All → Significantly]

4. How valued do you feel for your contributions?
   [1-5 scale: Not Valued → Very Valued]

5. What's one thing that would improve your experience?
   [Open text]

Track trends over time. Declining scores = intervention needed.
Combining Signals
When quantitative metrics (Git patterns) and qualitative data (survey responses) align, confidence in the diagnosis increases:
| Git Signal | Survey Signal | Combined Diagnosis |
|---|---|---|
| Increased off-hours commits | Low workload sustainability score | Burnout risk: HIGH |
| Reduced collaboration | Low "valued" score | Disengagement risk: HIGH |
| Single-repo focus | Low "learning" score | Stagnation risk: MEDIUM |
Track Team Health Holistically
CodePulse combines collaboration patterns, workload distribution, and review quality into a team health dashboard - without individual surveillance metrics.
The Retention Playbook
Based on research and practice, here's a structured approach to engineering retention:
Tier 1: Prevention (Always Active)
- Weekly 1:1s focused on growth and blockers
- Quarterly career conversations with explicit growth plans
- Monthly team health reviews (workload, review load, patterns)
- Regular recognition and celebration of contributions
- Compensation reviews at market rate (not below)
Tier 2: Early Intervention (When Signals Appear)
- Workload rebalancing when distribution skews
- 1:1 conversations when engagement patterns change
- Growth opportunities when stagnation signals appear
- Review load caps when individual burden exceeds threshold
Tier 3: Crisis Response (When Risk is High)
- Skip-level conversations to understand full picture
- Immediate workload reduction
- Explicit retention offers (comp, role, growth)
- Manager coaching or change if manager is the issue
Conclusion: Retention is a System Problem
Developer retention isn't about perks, ping-pong tables, or meditation apps. It's about sustainable workload, growth opportunities, manager quality, and recognition. These are system properties, not individual choices.
Use data to detect problems early. Use pattern analysis, not surveillance. Fix systems, not people. And remember: if your engineers are burning out, that's feedback about your organization, not about them.
Final Take
The best retention strategy is being a good place to work. No amount of data analysis can substitute for sustainable workloads, growth opportunities, and competent management. Use metrics to detect when you're falling short of those fundamentals - then fix the fundamentals, not the metrics.
Related Resources
- Burnout Signals in Git Data: What Patterns Reveal
- Engineering Effectiveness: Why Fast Teams Still Fail
- Review Load Balancing: Fair Distribution of Code Reviews
- Building Trust with Engineering Metrics
Monitor Team Health, Not Individuals
CodePulse provides team-level insights into workload distribution, collaboration patterns, and review balance - helping you detect retention risks before they become resignations.
Free tier available. No credit card required.
See these insights for your team
CodePulse connects to your GitHub and shows you actionable engineering metrics in minutes. No complex setup required.
Free tier available. No credit card required.
See These Features in Action
Compare contribution patterns for coaching, not surveillance.
Get notified when cycle times spike or review patterns degrade.
Related Guides
Your Git Data Predicts Burnout 6 Weeks in Advance
Use the STRAIN Score framework to detect developer burnout from Git data. Identify after-hours patterns, review overload, and intensity creep before they cause turnover.
Performance Reviews Without the Lawsuit Risk
Performance reviews are biased. Use engineering data to write reviews that celebrate "Glue Work," recognize invisible impact, and eliminate recency bias without creating a surveillance culture.
Engineering Team Management: Using Data to Lead Without Micromanaging
Managing software teams requires balancing delivery, quality, team health, and individual growth. This guide shows how to use data for visibility while avoiding surveillance, with practical scenarios and communication patterns.
Engineering Effectiveness: Why Fast Teams Still Fail
Efficiency is doing things right. Effectiveness is doing the right things. This guide introduces the Effectiveness Ladder framework and shows how to move from optimizing velocity to optimizing value.
Developer Joy Metrics: Measuring What Makes Developers Happy
Developer joy isn't soft - it's strategic. Learn measurable proxies for developer happiness, warning signs in git data, and how to build joy-aware teams.