
Find quality and ownership risk before it becomes an incident
Preview how CodePulse combines review depth, risky changes, hotspots, and knowledge concentration without turning activity into individual scores.
Read-only GitHub · Your code stays yours · Team-level by default · No credit card
Cyclomatic complexity is the oldest and still most widely reported code complexity metric: a count of how many independent paths run through a function's logic. It's cheap to compute, easy to explain in a code review comment, and - on its own - a surprisingly weak predictor of whether a given function is actually hard to work with. Understanding what the number does and doesn't tell you matters more than memorizing the formula.
What is cyclomatic complexity?
Cyclomatic complexity, introduced by Thomas McCabe in 1976, counts the number of independent paths through a function's control flow: every if, loop, case, and boolean condition adds one to a base score of 1. Scores of 1-10 are considered simple, 11-20 moderate, 21-50 complex, and above 50 effectively untestable, since the number of test cases needed to cover every path grows past what teams realistically write. It's most useful as a testing-coverage signal - how many test cases a function needs - and less useful as a readability signal, which is what the newer cognitive complexity metric was built to address.
The metric predates most of the languages it's now measured in. McCabe was working with FORTRAN control-flow graphs in 1976, and the underlying idea - a function's branch count maps to how many tests you need to exercise every path - has survived essentially unchanged into every modern linter's complexity rule.
Cyclomatic complexity answers "how many tests does this need?" It was never built to answer "how hard is this to read?" - and treating it as if it does is where most teams go wrong with the number.
How Is Cyclomatic Complexity Calculated?
The formal definition comes from graph theory: M = E - N + 2P, where E is the number of edges in the control-flow graph, N the number of nodes, and P the number of connected components (almost always 1 for a single function). In practice, no tool builds an explicit graph anymore - they walk the abstract syntax tree and increment a counter for every decision point: if, else if, for, while, case, ternary expressions, and boolean operators (&&, ||) inside a condition. A function with zero branches starts at 1; each additional decision point adds one.
Why Does It Matter, and Where Does It Fall Short?
Two findings, replicated across decades of empirical software-engineering research, keep cyclomatic complexity relevant despite its age. First, it correlates with defect density: more independent paths generally means more paths nobody wrote a test for, and untested paths are where bugs live. Second, it correlates with modification time: a reviewer or a future maintainer takes measurably longer to safely change a function with twenty branches than one with three.
The correlation is real but loose, and that looseness is the metric's main weakness. A long, flat function with ten sequential if statements that each handle one independent case can score as "complex" while reading easily top to bottom, because each branch is simple and there's no nesting to track. A short function with three deeply nested conditionals can score lower while being genuinely hard to follow, because nesting depth - not raw branch count - is what actually taxes a human reader's working memory. Cyclomatic complexity was designed to answer "how many tests does this need," and it does that reasonably well. It was never designed to answer "how hard is this to read," which is the gap cognitive complexity was built to close.
| Score range | Risk level | Typical action |
|---|---|---|
| 1-10 | Simple, low risk | No action needed |
| 11-20 | Moderate | Worth a second look in review |
| 21-50 | Complex, high risk | Flag for refactoring before the next change |
| 50+ | Effectively untestable | Split the function before adding anything else to it |
* Our Take
A CI gate on cyclomatic complexity is worth having. A team that treats the number as a quality score is measuring the wrong thing.
Use it as a testing-coverage tripwire - a function above 20 needs more test cases than most teams actually write, so flag it and either add tests or split it. Don't use it as a proxy for "this file is a mess" on its own; pair it with cognitive complexity for readability and with real change history (which files people actually struggle with in practice) before deciding what to refactor first.
Where Does CodePulse Fit?
CodePulse doesn't parse function bodies or compute a cyclomatic complexity score - that's squarely a static-analysis job, and tools built for it (SonarQube, CodeClimate, language-specific linters) do it well. What CodePulse tracks from the same GitHub history is the signal that tells you where to point that tooling first: which files change constantly, how concentrated ownership is, and how much churn a file absorbs release after release. High-complexity code and high-churn, single-owner code overlap often enough that the two views are worth running side by side.
* How to See This in CodePulse
Navigate to File Hotspots to see the files most worth running a complexity scan against:
- Change frequency and total lines changed per file, ranked by risk level
- Unique contributor count, so you can see whether a hot file also has thin ownership
- Pair it with code churn trends to see whether the same files keep resurfacing release after release
A complexity score tells you a function is hard to test. Change history tells you whether anyone's actually paying that cost yet.
For the readability half of this picture, see our cognitive complexity guide. For the broader discipline both metrics feed into, see what quality engineering actually covers or our bus factor and knowledge silo guide for the ownership-concentration angle on the same risky files.
If you want to see your own file hotspots before deciding what to refactor, start a free CodePulse trial. It reads directly from your GitHub history, so there's nothing to configure before you see real numbers.
Frequently Asked Questions
The widely cited bands, from McCabe's original 1976 paper and later tooling defaults, are: 1-10 is simple and low risk, 11-20 is moderate and worth a second look, 21-50 is complex and high risk, and above 50 is considered untestable in practice - the number of test cases needed to cover every path grows past what any team actually writes. Most linters (ESLint's complexity rule, SonarQube, CodeClimate) default their warning threshold somewhere in the 10-15 range for a single function.
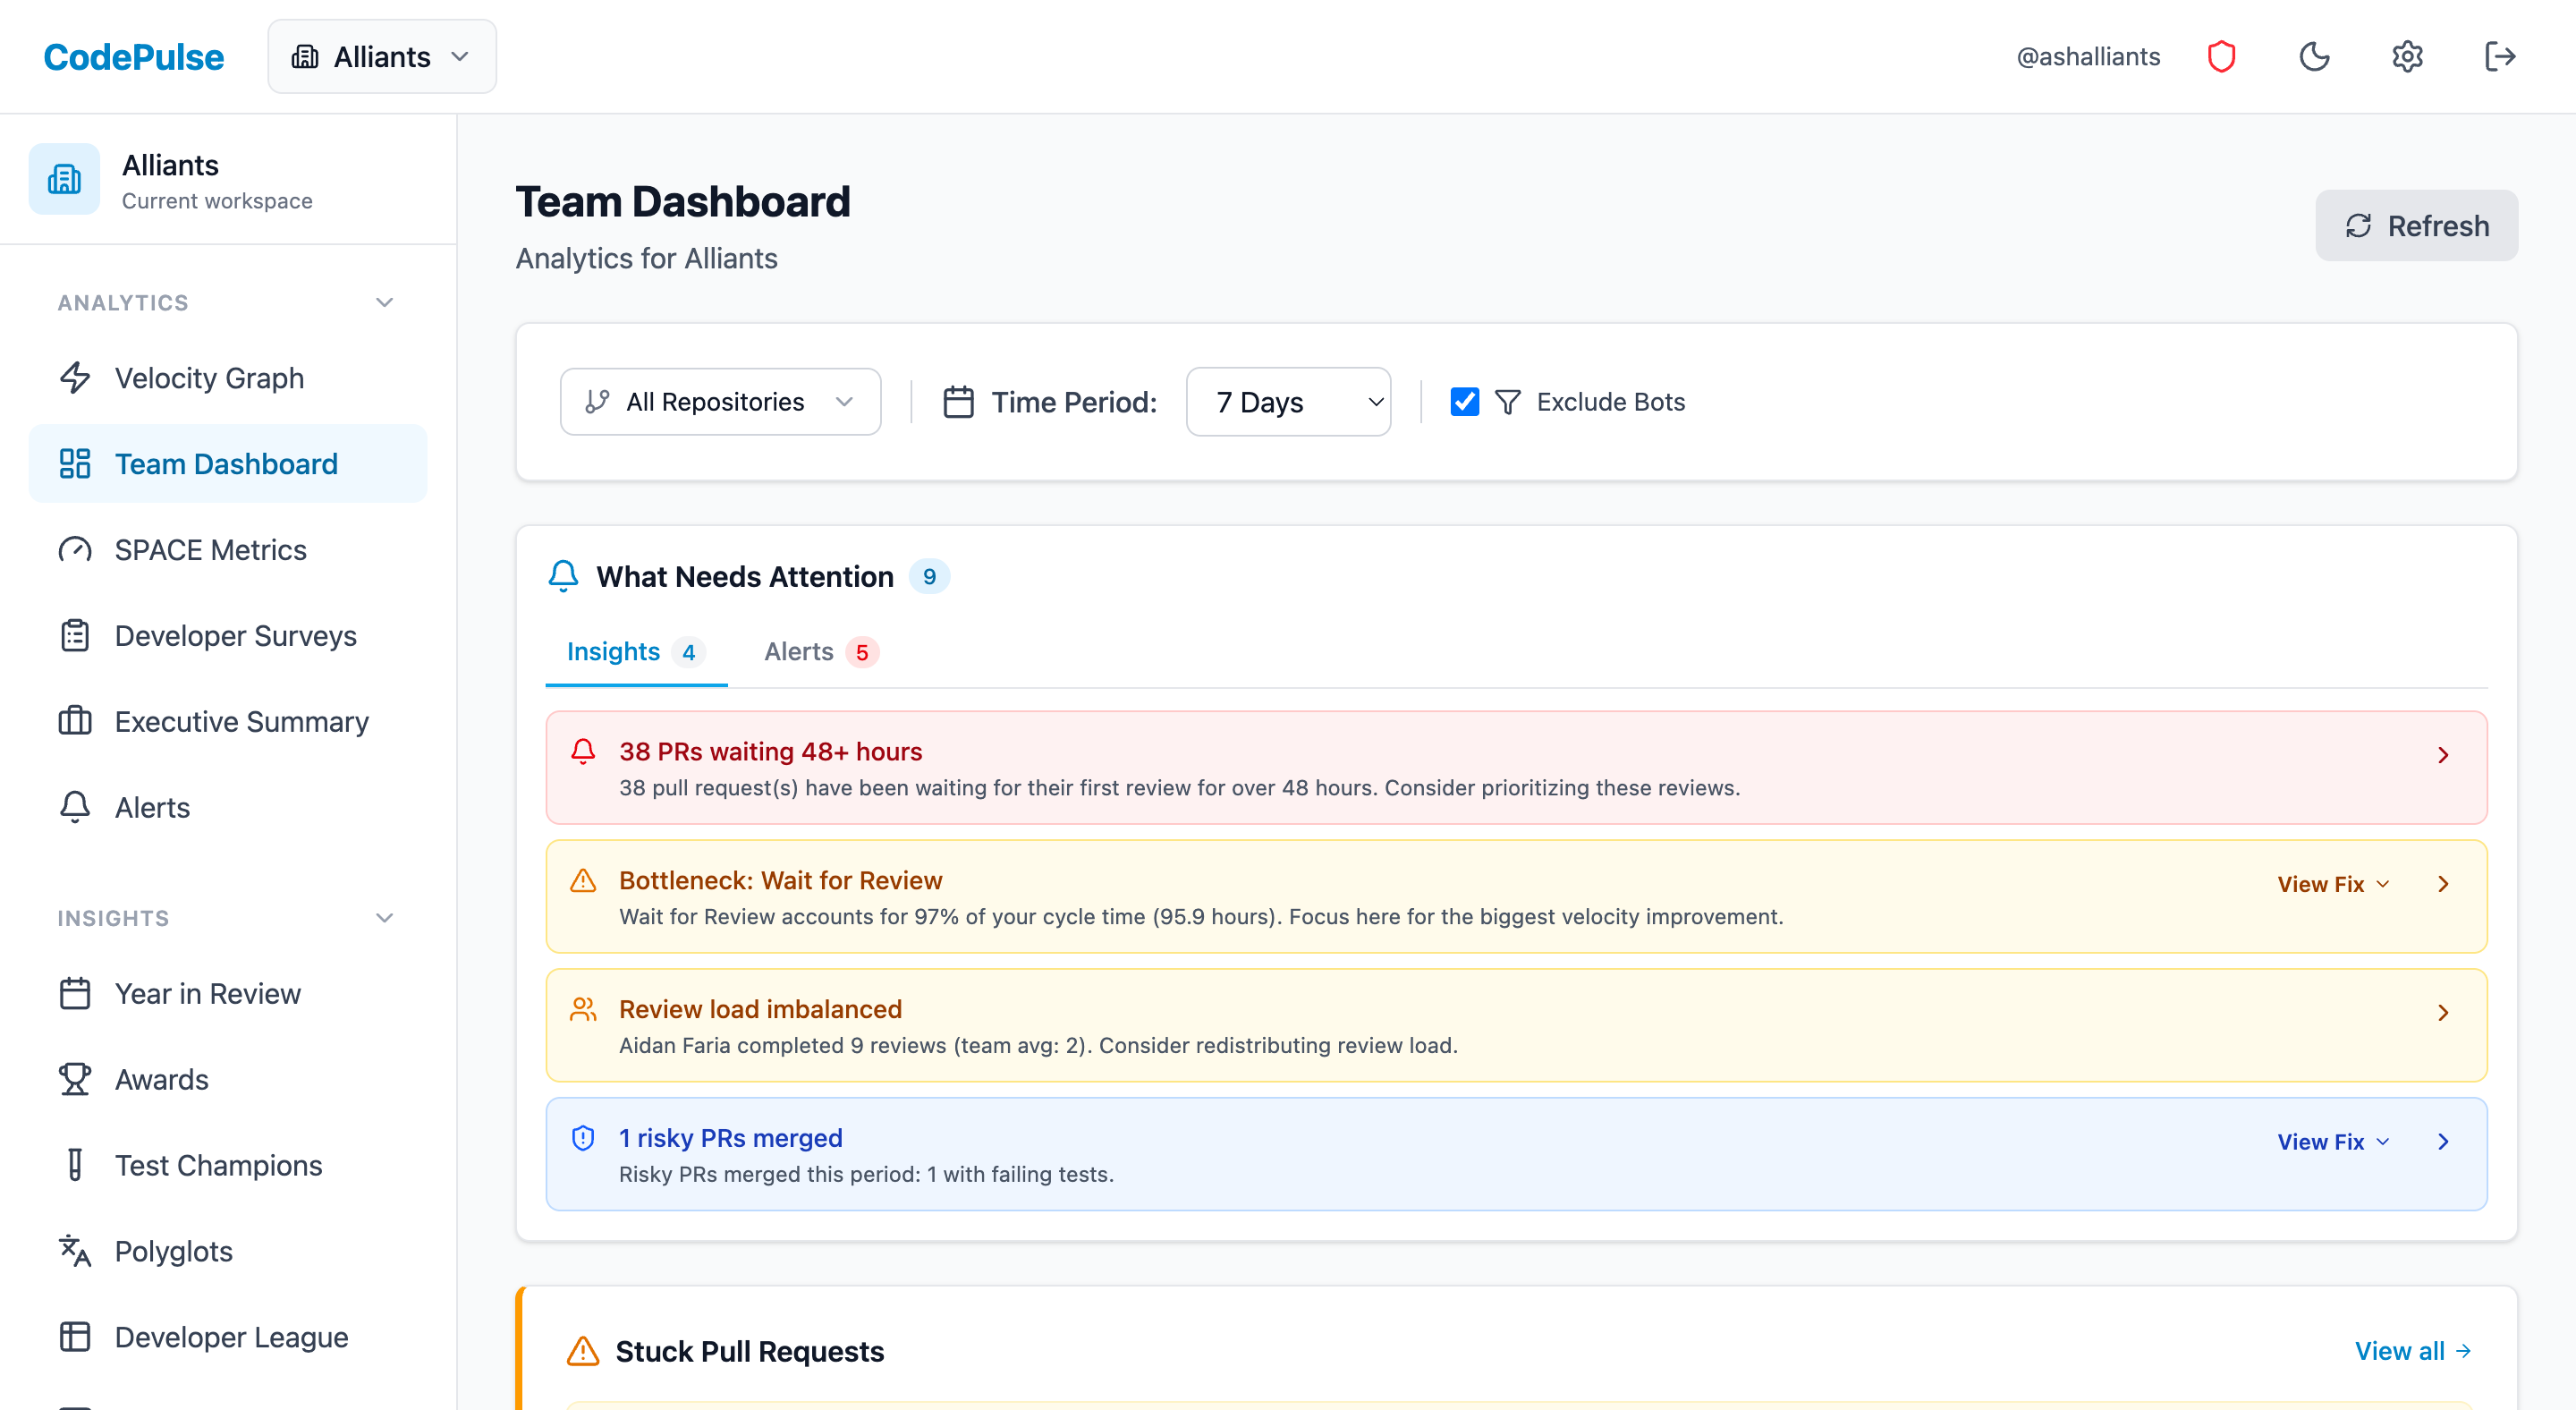
See which files and owners carry your real risk
Connect GitHub and get your churn hotspots, single-owner modules, and review-depth signals ranked by exposure. No repository cloning, no file contents read.
Read-only GitHub · Your code stays yours · Team-level by default · No credit card
See These Features in Action
Explore all featuresRelated Guides
Cognitive Complexity Explained (vs Cyclomatic)
What cognitive complexity measures, how SonarSource's algorithm scores nesting and control-flow breaks, and how it differs from cyclomatic complexity.
What Is Quality Engineering? (vs QA)
Quality engineering distributes quality checks across design, review, CI, and production monitoring instead of a single QA gate before release.
The 'Bus Factor' File That Could Kill Your Project
Use the Bus Factor Risk Matrix to identify where knowledge concentration creates hidden vulnerabilities before someone leaves.
High Code Churn Isn't Bad. Unless You See This Pattern
Learn what code churn rate reveals about your codebase health, how to distinguish healthy refactoring from problematic rework, and when to take action.
Code Quality Tools in 2026: Most Are Useless (3 Aren't)
Compare engineering analytics tools specifically for code quality features: hotspot detection, knowledge silos, test analytics, and review sentiment.