See these metrics for your own team
CodePulse turns your GitHub history into engineering insights in about 5 minutes. Free to start, no credit card.
Get started freeIf you are a VP or Director of Engineering preparing for a board meeting, this guide is for you. Boards ask three questions: Are we shipping what we promised? Is it costing what we budgeted? Is the team healthy enough to sustain it? According to a Jellyfish survey, board members consistently say they "don't get what they need" from engineering updates. The 7 metrics below answer those questions in board language, and they double as ammunition for defending headcount requests. CodePulse's Executive Summary page generates these automatically.
What metrics should a VP of Engineering present to the board?
Focus on 7 metrics organized into three categories boards care about: delivery predictability (cycle time trend, deployment frequency), cost efficiency (investment allocation ratio, cost per feature shipped), and team health (attrition risk indicators, review load balance, knowledge silo percentage). Skip story points, commit counts, and lines of code. Boards want to know if you are shipping what was promised, at the budgeted cost, with a team healthy enough to sustain it. CodePulse generates board-ready executive summaries with these metrics automatically.
Related guides in this series
- DORA Metrics Explained - deep dive into the four keys and how to measure them from GitHub
- Platform Engineering Metrics - KPIs that prove infra team impact (different benchmarks than app teams)
- Metrics Rollout Playbook - change management for introducing metrics without triggering resistance
- Analytics ROI Calculator - build the budget case with payback period and cost-per-hour formulas
"The board doesn't care about story points. They care about three things: Are we shipping what we promised? Is it costing what we budgeted? Is the team healthy enough to sustain it?"
Why Do Boards and Engineering Leaders Talk Past Each Other?
According to Jellyfish's research on board communication, investors and board members consistently say they "don't get what they need" from engineering leaders. The disconnect? Engineering leaders talk about PRs and velocity while boards want to know: When will features ship? How much does it cost? What's the ROI?
A Gartner CIO agenda report found that 59% of digital initiatives take longer than VPs expect, and 52% take too long to deliver expected value. This gap between engineering reality and executive expectations is the problem metrics need to solve.
🔥 Our Take
Most VP dashboards are glorified spreadsheets that make engineering look busy. Real engineering intelligence requires understanding why metrics move, not just that they moved.
A dashboard that shows "cycle time improved 20%" is useless if you can't explain what changed. Boards don't want data - they want insight and confidence that you understand your organization.
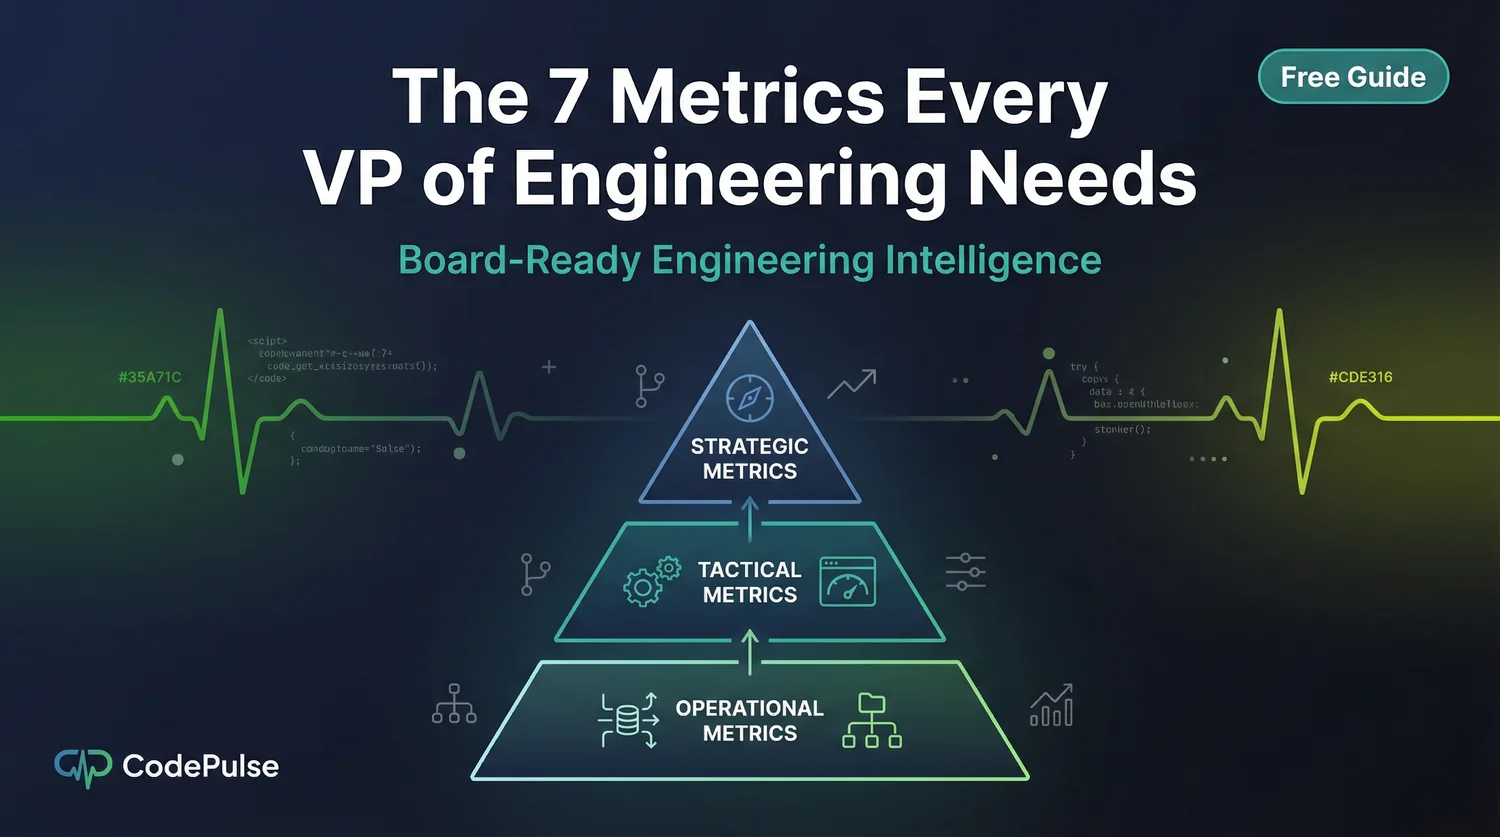
The VP Dashboard Pyramid: 3 Tiers of Metrics
Not all metrics serve the same purpose. We organize VP metrics into three tiers based on who needs to see them and what decisions they inform.

Tier 1: Strategic Metrics (Board-Level)
These are the metrics your board and CEO actually care about. They answer: "Is engineering a well-run function that delivers business value?"
| Metric | What It Answers | Target |
|---|---|---|
| Delivery Predictability | Do we ship what we promise, when we promise it? | > 80% of commitments met |
| Cost per Feature | How efficient is our engineering investment? | Trending down over time |
| Engineering Health Grade | Is the team sustainable? Any hidden risks? | A or B grade |
Notice what's NOT here: story points, velocity, lines of code. These are activity metrics that mean nothing to a board. Boards care about outcomes: predictable delivery, efficient spend, sustainable teams.
Tier 2: Tactical Metrics (Leadership-Level)
These metrics help you diagnose problems and make resource allocation decisions. They're for your leadership meetings, not board presentations.
| Metric | What It Reveals | Action Trigger |
|---|---|---|
| Cycle Time | How fast does code move from commit to production? | Investigate if > 72 hours |
| Change Failure Rate | How often do deployments cause problems? | Alert if > 15% |
| Review Coverage | Is code being properly reviewed? | Flag if < 90% |
| Capacity Utilization | Are teams overloaded or underutilized? | Rebalance at < 60% or > 90% |
Tier 3: Operational Metrics (Manager-Level)
These are the detailed metrics your engineering managers use daily. You should have access to them, but they shouldn't dominate your dashboard.
- PR Size: Are developers shipping small, reviewable changes?
- Review Load: Is review work distributed fairly?
- First Review Time: How quickly are PRs getting attention?
- Knowledge Silos: Are there single points of failure?
What Are the 7 Metrics Every VP of Engineering Needs?
Here are the specific metrics we recommend for VP-level visibility. Each one connects engineering activity to business outcomes. These map closely to the operational view covered in our engineering operations guide - the VP signal is a subset curated for board and exec conversations.
1. Delivery Predictability Score
What it measures: The percentage of committed work delivered on time.
Why it matters: This is the #1 question boards have about engineering. If you can't predict when features ship, you can't make reliable business commitments.
How to calculate: Track quarterly commitments vs. actual delivery. Include both scope changes and timeline misses. Target: 80%+ predictability.
"A team that delivers 80% of what they commit to is more valuable than a team that delivers 150% of random things."
2. Cycle Time (Median)
What it measures: The median time from first commit to production deployment.
Why it matters: Cycle time is a leading indicator of team health. Long cycle times indicate bottlenecks, process problems, or team overload.
Benchmarks: According to LinearB's study of 8.1 million PRs, elite teams achieve cycle times under 24 hours. Most teams should target under 72 hours.
For detailed cycle time analysis, see our cycle time breakdown guide.
3. Deployment Frequency
What it measures: How often you ship code to production.
Why it matters: High deployment frequency indicates small batch sizes, good automation, and confidence in your delivery pipeline. It's a proxy for agility.
Targets by team type:
| Team Type | Expected Frequency |
|---|---|
| Consumer web/mobile | Multiple times per day |
| B2B SaaS | Daily to weekly |
| Enterprise/Regulated | Weekly to monthly |
| Embedded/Hardware | Monthly to quarterly |
4. Change Failure Rate
What it measures: The percentage of deployments that cause production issues.
Why it matters: This is the quality counterbalance to velocity metrics. High deployment frequency only matters if those deployments work.
Target: Under 15% (DORA "elite" benchmark). Investigate any trend above 10%.
See our change failure rate and MTTR guide for measurement approaches.
5. Engineering Health Score
What it measures: A composite score across multiple health dimensions.
Why it matters: A single letter grade (A-F) gives executives instant understanding without requiring deep technical knowledge.
Dimensions to include:
- Delivery: Cycle time, deployment frequency
- Quality: Test pass rate, review coverage, merge without approval rate
- Sustainability: Review load balance, knowledge distribution, working hours
📊Engineering Health Score in CodePulse
CodePulse calculates a composite health grade automatically:
- Go to Executive Summary for the overall health grade
- See breakdown by dimension (velocity, quality, collaboration)
- Drill down into specific issues flagged
- Track grade changes over time
6. Investment Allocation
What it measures: How engineering effort is distributed across categories.
Why it matters: Boards want to know: How much goes to new features vs. maintenance? Technical debt vs. innovation? This metric answers those questions.
Typical healthy breakdown:
| Category | Target Range |
|---|---|
| New Features | 40-60% |
| Maintenance/KTLO | 20-30% |
| Technical Debt | 10-20% |
| Infrastructure/Platform | 10-15% |
For more on this, see our KTLO vs innovation guide.
7. Risk Indicators
What it measures: Early warning signals of problems.
Why it matters: Proactive VPs catch problems before they become crises. These indicators help you have answers before the board asks questions.
Key risk signals:
- Knowledge silos: Files with only one contributor (bus factor risk)
- Review bottlenecks: Uneven review load distribution
- Quality flags: PRs merged without approval, failing tests bypassed
- Sustainability: After-hours commits, unusually high workload
See our risky deployments guide for detailed detection approaches.
Presenting to the Board: A Framework
When you present engineering metrics to the board, structure your update around three questions they actually care about. Our engineering portfolio reporting guide shows the full reporting cadence - weekly team view → monthly VP view → quarterly board view - with example artifacts at each tier.
Question 1: "Are we shipping what we promised?"
Lead with: Delivery predictability score and major milestones.
Example: "We committed to 4 major features this quarter and shipped 3 on time. The fourth is delayed 2 weeks due to [specific reason]. Predictability score: 85%, up from 72% last quarter."
Question 2: "Is it costing what we budgeted?"
Lead with: Investment allocation and efficiency trends.
Example: "Engineering spend is $X this quarter. 55% went to new features, 25% to maintenance, 20% to debt reduction. Cycle time improved 30%, meaning we're shipping more per dollar invested."
Question 3: "Is the team healthy?"
Lead with: Health score and any risk flags.
Example: "Overall health grade: B+. One flag: our payments team has knowledge concentration risk - we're addressing with cross-training this sprint."
🔥 Our Take
Never present metrics without context. A 20% improvement means nothing if the board doesn't know what changed and whether it's sustainable.
The best VP presentations follow "metric → insight → action" structure. "Cycle time dropped 20% [metric] because we reduced PR size [insight] by implementing our new review guidelines [action]."
Using Industry Benchmarks Effectively
Benchmarks help boards contextualize your performance. But use them carefully - context matters more than absolute numbers.
According to 2025 engineering benchmarks:
| Metric | Elite | High | Medium |
|---|---|---|---|
| Cycle Time | < 24h | < 72h | < 7 days |
| PR Review Time | < 4h | < 24h | < 48h |
| Deployment Frequency | Multiple/day | Daily | Weekly |
| Change Failure Rate | < 5% | < 15% | < 30% |
When to use benchmarks: To show trajectory ("We moved from Medium to High tier this year") or to justify investment ("Elite teams deploy 10x more frequently - here's our plan to get there").
When NOT to use benchmarks: To set arbitrary targets ("We must hit elite by Q3") or to compare teams with different contexts.
5 Mistakes VPs Make with Metrics
Mistake 1: Too Many Metrics
If your dashboard has more than 10 top-level metrics, nobody is looking at it. The human brain can track 5-7 things effectively. More metrics means less attention on what matters.
"The VP with 50 dashboard metrics doesn't have better visibility - they have analysis paralysis."
Mistake 2: Presenting Activity Instead of Outcomes
Story points completed, PRs merged, commits made - these are activity metrics. They show people are busy, not that they're effective. Boards see through this quickly.
Mistake 3: No Trend Context
A point-in-time metric is almost useless. "Our cycle time is 48 hours" means nothing without trend: Is it improving? Stable? Getting worse?
Mistake 4: Ignoring Qualitative Signals
Metrics can't capture everything. Team morale, technical debt burden, and organizational friction require human judgment. The best VPs combine quantitative metrics with qualitative team health checks.
Mistake 5: Using Metrics to Judge Individuals
The moment individual metrics become performance criteria, they stop being useful. Engineers will game the numbers instead of doing good work. Use metrics for system improvement, not individual evaluation.
For more on this, see our guide to measuring without micromanaging.
Getting Started: Your First Dashboard
Here's a practical plan for building your VP dashboard:
Week 1: Establish Baselines
- Connect your repositories to a metrics platform
- Measure current cycle time, deployment frequency, and change failure rate
- Calculate your delivery predictability for last quarter
- Document your investment allocation (feature vs. maintenance vs. debt)
Week 2: Build Your Dashboard
- Set up the 7 metrics described above
- Add trend lines (at least 90 days of history)
- Configure alerts for significant changes
- Create a board-ready summary view
Week 3: Calibrate and Validate
- Review metrics with your engineering managers - do they match ground truth?
- Identify any data quality issues
- Set initial targets based on current baselines
- Practice your board presentation narrative
Week 4: Operationalize
- Establish a weekly metrics review cadence
- Define escalation criteria for risk indicators
- Share appropriate views with your leadership team
- Schedule first board presentation with new metrics
The Bottom Line
VP dashboards fail when they try to show everything. They succeed when they answer the questions that matter: Are we shipping predictably? Are we spending efficiently? Is the team healthy?
Focus on the 7 metrics in this guide. Present them with context and trends. Connect every number to a business outcome. Your board will stop asking "What does engineering actually do?" and start asking "How can we invest more?"
For a broader overview of engineering metrics, see our comprehensive engineering metrics guide. For board-specific communication, check out our board-ready metrics guide.
Frequently Asked Questions
Boards care about three things: delivery predictability (are we shipping what we promised, on time?), cost efficiency (what does engineering output cost relative to revenue?), and team sustainability (is the team healthy enough to maintain this pace?). Translate engineering metrics into these business terms.
See these insights for your team
CodePulse connects to your GitHub and shows you actionable engineering metrics in minutes. No complex setup required.
Free tier available. No credit card required.
See These Features in Action
Board-ready engineering performance in a single page.
Track all four DORA metrics and benchmark against industry standards.
Related Guides
The Complete Guide to Engineering Metrics in 2026
Engineering metrics are everywhere, but most teams measure the wrong things. This guide covers what to measure, what to ignore, and how to build a metrics program that drives decisions - not just reports.
I Got $2M in Budget With These 5 Engineering Metrics
Learn how to create engineering metrics presentations that resonate with board members, investors, and C-suite executives.
Engineering Metrics Dashboard: The 7 Metrics You Need
Skip vanity metrics. Here are the 7 engineering metrics VPs actually need to track team performance, delivery, and quality.
The A-F System That Fixed Our Broken Engineering Team
Build health scorecards that give executives and stakeholders instant visibility into engineering team performance.
Why the 70/30 Rule Is Killing Your Engineering Team
Find the right balance between shipping new features and maintaining existing code using engineering metrics and data-driven strategies.