
Turn this metric into a baseline for your team
Preview a system-level engineering health report, then connect GitHub when you are ready to compare this metric with your own delivery history.
Read-only GitHub · Your code stays yours · Team-level by default · No credit card
Sprint velocity is the metric most teams reach for first and misuse fastest. Used as a planning aid, it answers a modest, useful question: roughly how much can we commit to next sprint? Used as a scorecard, it quietly corrupts your estimates and tells your team that looking busy beats shipping value.
What is sprint velocity and how do you calculate it?
Sprint velocity is the total number of story points a Scrum team completes in one sprint. You calculate it by adding up the points for every story that is fully done at the end of the sprint - partial work counts as zero. For planning, teams average velocity across the last three to five sprints to get a stable range. Velocity measures the amount of work completed, not speed, value, or productivity, and it cannot be compared between teams because story points are calibrated locally.
This guide covers what velocity actually measures, how to calculate it honestly, and why it falls apart the moment anyone treats it as a productivity number. Then it shows you the flow metrics that answer the questions velocity only pretends to.
🔥 Our Take
Velocity is a capacity dial for the team that owns it, and nothing more. The second it shows up on a manager's dashboard as a performance number, you have taught your engineers that the fastest way to succeed is to inflate their estimates.
We think velocity earns its place in sprint planning and loses it everywhere else. If you want to know whether your team is delivering, look at what reached production and how long it took to get there. Velocity cannot tell you either.
What Is Sprint Velocity?
Sprint velocity is the sum of story points a team completes in a single sprint. It reflects the amount of work a Scrum team turned into a finished increment, expressed in the relative estimation units the team uses for its backlog. According to Atlassian's Scrum guidance, velocity measures team capacity rather than speed, and it is always tracked at the team level, never for individuals.
The word "velocity" borrows from physics, where it means distance over time. In Scrum it loses that precision. Story points are not a unit of time or output. They are a relative guess about effort and complexity, agreed by the team during estimation. So velocity really means "estimated effort we marked as done last sprint," which is a much narrower idea than the name suggests.
"Velocity is a result, not a target. There is no good or bad velocity - only your team's normal range, which you use to plan the next sprint."
One detail trips people up constantly: only fully completed work counts. A story that is 90% done contributes zero points to this sprint's velocity. Scrum treats items as either done or not done, with nothing in between, because a half-finished story carries risk you cannot measure. That binary rule keeps velocity honest as a planning input, and it explains why a single sprint's number can swing wildly.
How Do You Calculate Sprint Velocity?
You calculate sprint velocity by adding the story points of every story that met your Definition of Done during the sprint. If you finished stories worth 4, 2, and 3 points, your velocity for that sprint is 9. If you only finished half of the 4-point story, none of its points count, and your velocity drops to 5. The math is deliberately simple so the team can do it in seconds during the sprint review.
A single sprint is too noisy to plan with. Absences and mid-sprint surprises push the number around from one iteration to the next. So teams average velocity across the last three to five sprints. If a team completes 25, 28, and 30 points in three sprints, its average velocity is 27.6, and that average becomes the anchor for the next sprint's commitment.
For velocity to mean anything, the team needs a shared Definition of Done and a consistent approach to estimation. When people disagree about velocity, the argument almost always comes down to what a story point represents. Nail that down first, or the number will drift every time someone new joins the estimation session.
What Is a Good Sprint Velocity?
There is no universal good velocity, and anyone who quotes you a target number is selling something. A velocity of 40 is not better than 25. The two numbers come from different teams whose point scales and Definitions of Done never line up. The only useful comparison is a team against its own recent history.
A healthy velocity has one property that matters: it is stable enough to plan with. If your last five sprints landed at 26, 29, 24, 28, and 27, you have a dependable range, and you can commit to roughly 26 points next sprint with reasonable confidence. If they landed at 15, 40, 20, 45, and 18, the average of 27.6 is technically correct and practically useless, because the underlying process is too erratic to forecast.
"Stability beats size. A predictable velocity of 25 is worth far more to a planning conversation than a volatile average that happens to be higher."
When velocity climbs sprint after sprint, resist the urge to celebrate. Real capacity does not usually grow in a smooth upward line. A rising velocity often signals estimate inflation rather than a faster team, which is exactly the failure mode the next section describes.
Why Is Sprint Velocity a Flawed Productivity Metric?
Velocity fails as a productivity metric because it measures estimated effort completed, not value delivered. The people who created the estimation practices behind velocity have said this repeatedly. As Scrum.org explains, velocity is a planning technique for the team, and treating it as productivity confuses "amount of work done" with "value created" - the same fallacy that made lines of code a famously bad measure.
Here is the mechanical problem. Story points have no external anchor. Nobody can verify whether a 5-point story should have been a 3-point story, because points were never tied to anything measurable in the first place. So the moment velocity becomes a target, a rational team can hit any number leadership wants without changing a single thing about how they build software. They just estimate a little higher. This is Goodhart's Law in its purest form: once a measure becomes a target, it stops measuring anything.
This gaming is rarely malicious. It is the reasonable response of honest people to a measurement system that punishes honesty. If your estimate of 3 points makes you look slow and someone else's estimate of 8 for similar work makes them look fast, you learn to estimate higher. Transparency erodes, and the number leadership trusts becomes the number least worth trusting.
"Velocity has no external check. Nobody can prove a 5-point story should have been a 3, so the moment it becomes a target, the honest number quietly disappears."
Velocity also says nothing about quality. A team can post a high velocity while piling up technical debt that slows every future sprint. And because story points are calibrated per team, cross-team comparison is meaningless from the start. A manager who ranks teams by velocity is comparing measurements taken with different rulers. For a fuller treatment of why estimation itself often wastes time, see our guide on forecasting instead of estimating.
What Should You Track Instead?
If you want to know how your delivery is really going, track flow metrics drawn from your version control and deployment systems. Unlike story points, these come from timestamps and events that actually happened, so they are far harder to game and they map directly to how quickly value reaches users. The table below shows how velocity stacks up against the metrics that answer the questions people wrongly ask velocity to answer.
| Metric | What It Measures | Comparable Across Teams? | Easy to Game? |
|---|---|---|---|
| Sprint velocity | Estimated effort marked done per sprint | No (relative points) | Yes (inflate estimates) |
| Cycle time | Time from first commit to merge | Yes (real hours) | Hard (timestamps) |
| Throughput | Count of items shipped per week | Roughly (count of work) | Hard (real merges) |
| Deployment frequency | How often you ship to production | Yes (real deploys) | Hard (deploy events) |
Cycle time and deployment frequency come straight from the DORA metrics research, which ties delivery performance to outcomes teams care about. Throughput gives you the honest cousin of velocity: instead of counting estimated points, you count completed work items, which sidesteps the estimation game entirely. If review delays are dragging your cycle time, our guide on reducing PR cycle time walks through where the hours usually hide.
📊Flow Metrics in CodePulse
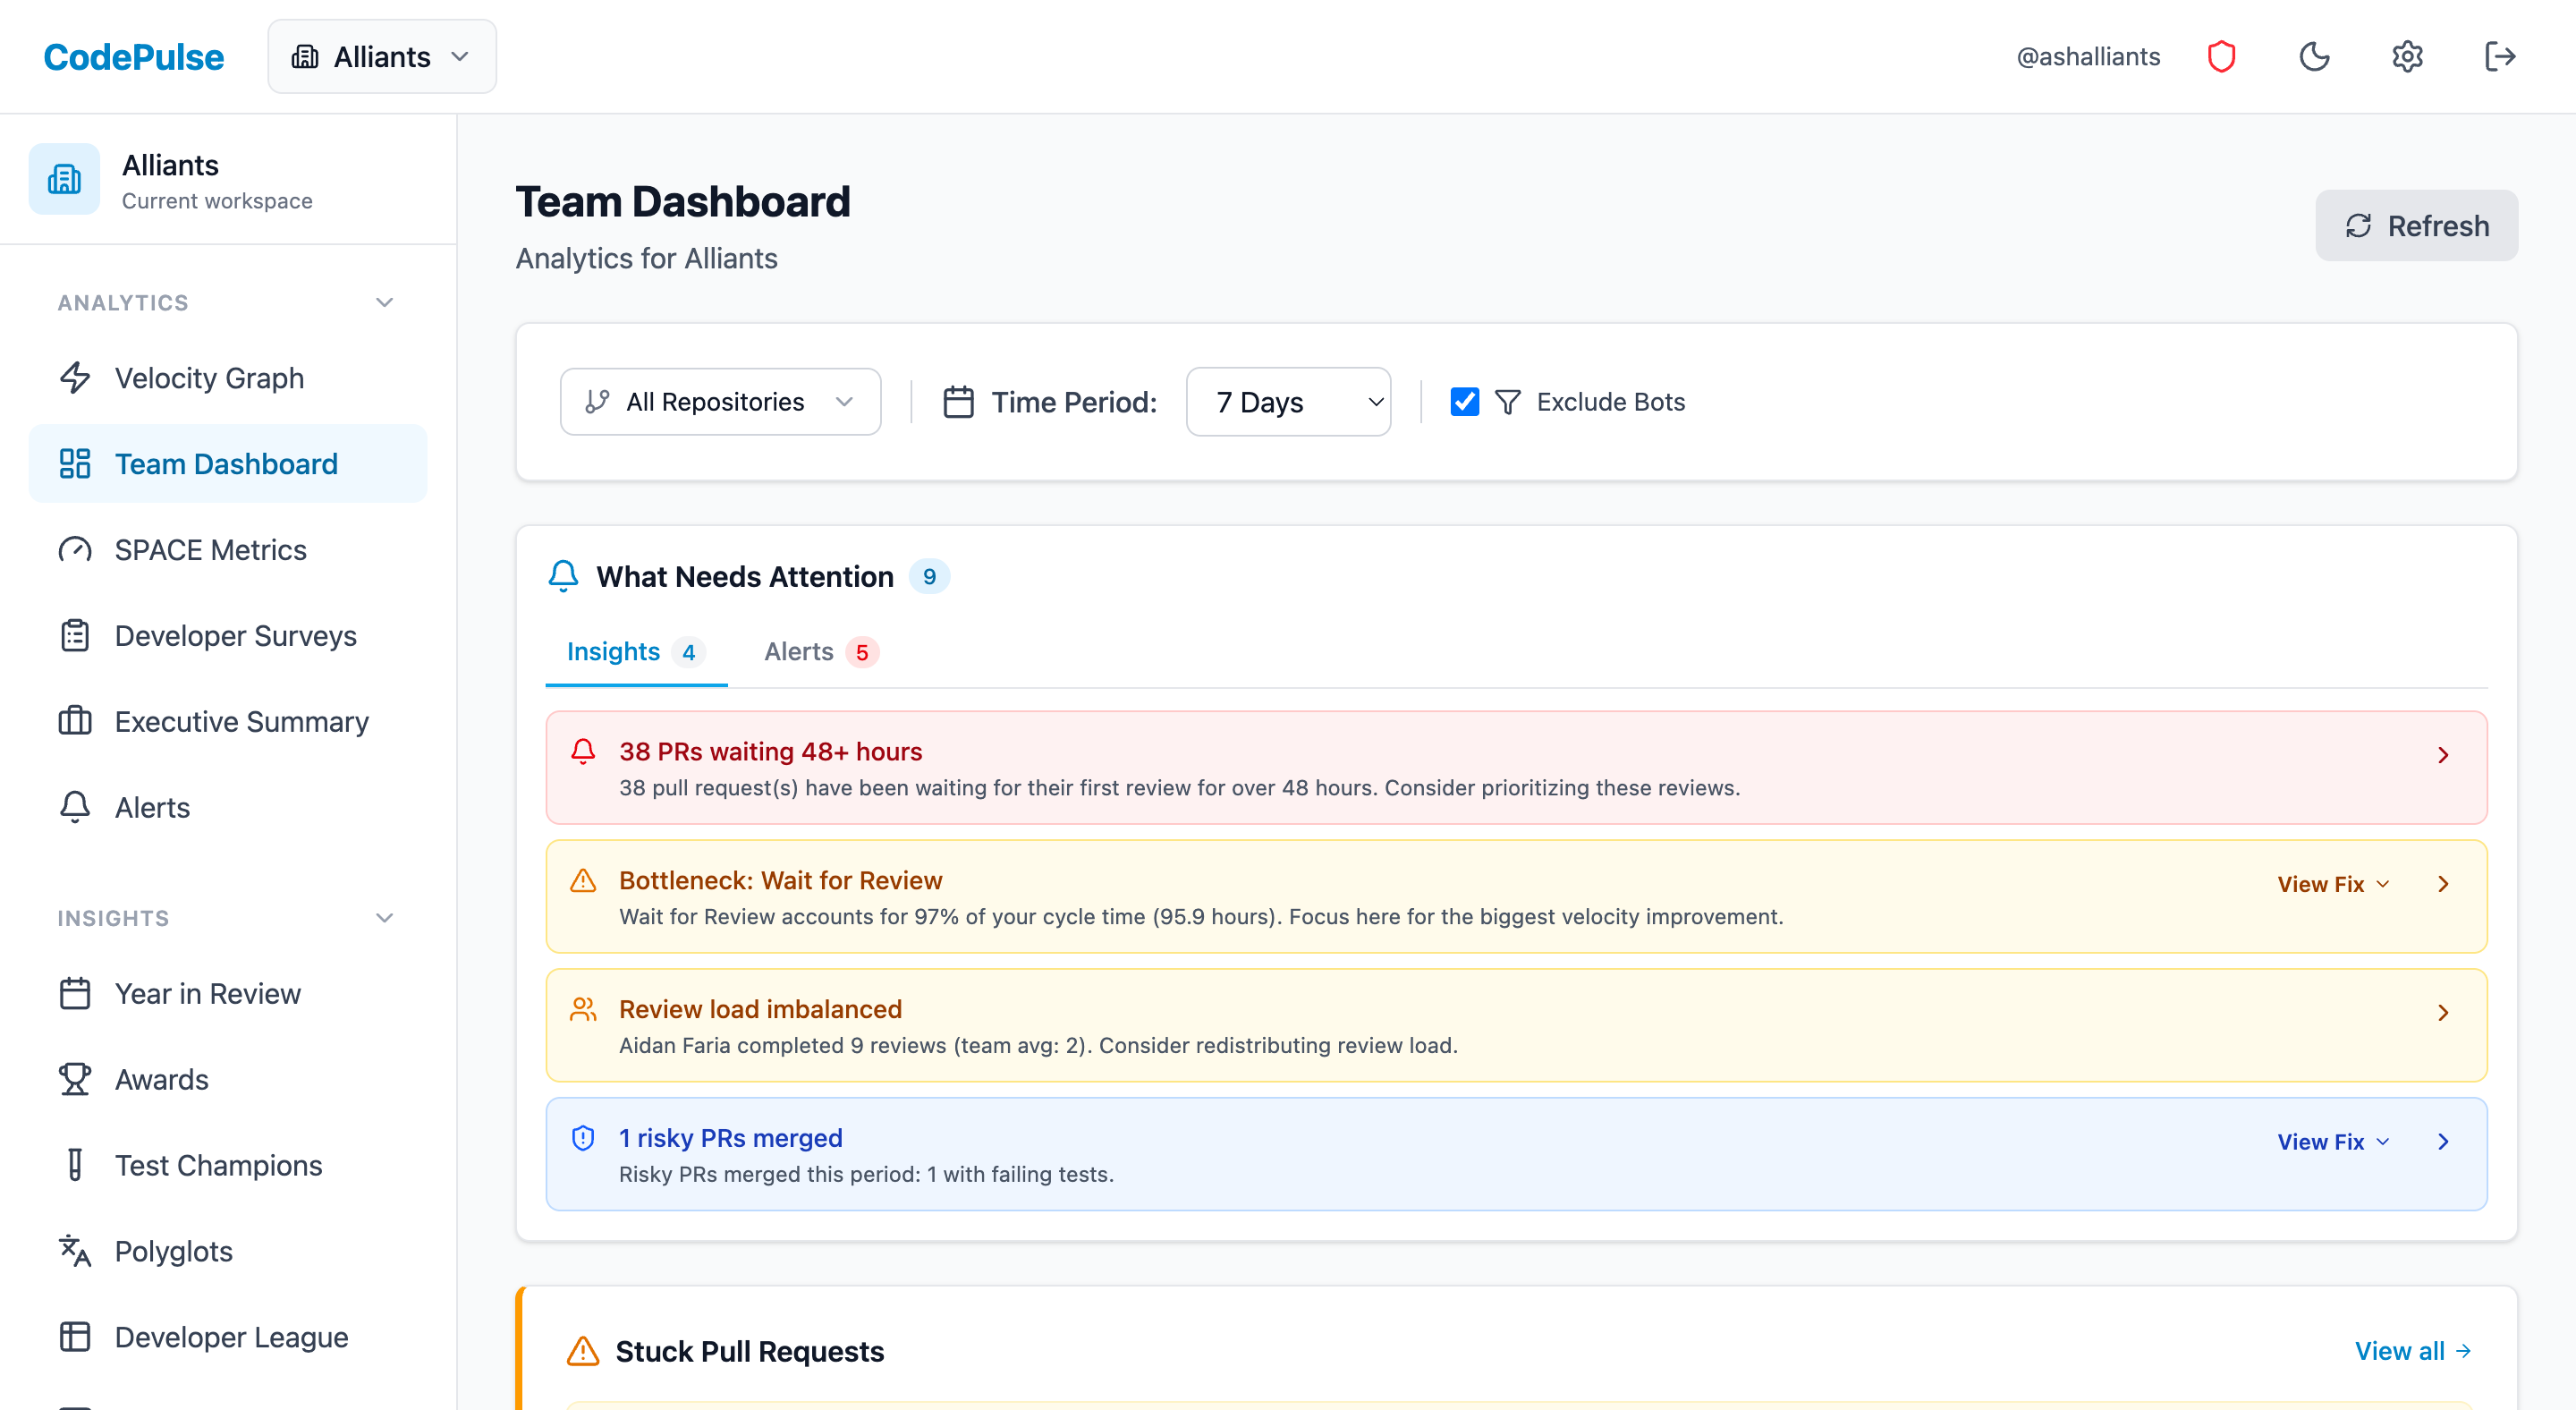
CodePulse reads flow metrics from your GitHub data automatically, so you get the numbers velocity can't give you without any manual estimation:
- See cycle time broken into coding, waiting, review, and merge phases per team.
- Track throughput and deployment frequency without asking anyone to estimate anything.
- Compare trends over time against your own history, never against another team's points.
How Do You Use Velocity Well?
Velocity works when you keep it inside the team and point it at one job: forecasting how much the team can reasonably take on next sprint. Used that way, it is a genuinely helpful planning aid. The team owns the number, the team reads the number, and the number never leaves the sprint planning room to become a slide in someone's status deck.
A few rules keep velocity useful:
- Keep it team-owned. Velocity belongs to the developers doing the work, as a tool for their own planning. It is not a management report.
- Never set it as a target. The moment a velocity number becomes a goal to hit, you have started the estimate-inflation cycle. Let it be a result you observe, not a bar you clear.
- Never compare teams. Different teams calibrate points differently, so cross-team velocity comparison measures nothing real.
- Pair it with delivery signals. Read velocity alongside cycle time and what actually shipped, so planning stays anchored to reality rather than to point totals.
- Expect variation. Holidays, sick days, and gnarly requirements will move the number. A stable range across several sprints matters more than any single figure.
This restraint is a management-culture question as much as a metrics one. When leaders promise never to weaponize velocity in performance reviews, teams keep estimating honestly, and the number stays trustworthy for the planning it was meant to support. For a broader look at modern velocity thinking, our developer velocity guide and our engineering velocity metrics guide cover the alternatives in depth.
The Bottom Line
Sprint velocity is a small, honest tool that becomes dangerous the instant you ask it to do a job it was never built for. As a team-owned planning aid it helps you commit to the right amount of work each sprint. As a productivity metric it invites estimate inflation and tempts managers into comparisons that mean nothing.
Use velocity for planning, keep it inside the team, and judge delivery by what reaches production and how long it took. Track cycle time, throughput, and deployment frequency for the questions velocity cannot answer, and you will spend a lot less time arguing about points and a lot more time shipping.
Related Guides
- Story Points Are a Scam: What Actually Works - Forecast delivery with throughput instead of estimates
- Story Points Are Dead: What Elite Teams Measure - Modern velocity metrics that reflect real delivery
- Engineering Velocity: 5 Metrics Without Burnout - Measure throughput and flow without gaming
- DORA Metrics Guide - The four keys that connect to business outcomes
- How to Reduce PR Cycle Time - Where delivery time actually goes
Frequently Asked Questions
Sprint velocity is the sum of story points a Scrum team completes in a single sprint. It measures how much work a team finished, not how fast they worked or how much value they created. Teams average velocity over several sprints to help plan how much they can take on next.
Now measure this metric on your own repositories
Connect read-only GitHub in about five minutes and get your baseline, your trend, and the constraint behind it. Your fourteen usable trial days start when the first repository finishes syncing.
Read-only GitHub · Your code stays yours · Team-level by default · No credit card
See These Features in Action
Break down cycle time into coding, waiting, review, and merge phases.
Track all four DORA metrics and benchmark against industry standards.
Related Guides
Story Points Are a Scam. Here's What Actually Works
Story points are often waste. Learn how to use historical throughput and cycle time to forecast delivery dates with higher accuracy and less meeting time.
Developer Velocity: Metrics Beyond Story Points
Measure developer and engineering velocity without story points: cycle time, deployment frequency, flow efficiency and sustainable pace, plus what DORA tracks today.
DORA Metrics Explained: The 4 Keys Without the Hype
A complete breakdown of the four DORA metrics - deployment frequency, lead time, change failure rate, and MTTR - with honest benchmarks and gaming traps to avoid.
We Cut PR Cycle Time by 47%. Here's the Exact Playbook
A practical playbook for engineering managers to identify bottlenecks, improve review processes, and ship code faster - without sacrificing review quality.