

Turn this metric into a baseline for your team
Preview a system-level engineering health report, then connect GitHub when you are ready to compare this metric with your own delivery history.
Read-only GitHub · Your code stays yours · Team-level by default · No credit card
Someone approved a budget for AI coding tools and now wants to know whether it worked. The honest answer requires being careful about what the usage data actually covers, because the obvious reading of it - count the people with usage, divide by the people you pay for - is wrong often enough to get licences cancelled for no reason.
How do you measure Claude Code adoption and ROI honestly?
Measure against a roster, not against usage alone. Pull the provisioned seat list from the provider as your denominator, then compare reported usage against it. When we did this on our own organization, the provider's usage report surfaced only a fraction of our provisioned seats over a 35-day window, with known-active people missing entirely - so a naive adoption percentage would have understated reality badly. A seat with no reported usage is unknown, not idle. CodePulse reports the shortfall explicitly rather than dividing one number by the other and calling it adoption.
Why Does Usage Data Alone Mislead You?
Usage reporting answers one question: which identities did the provider record activity for, and what did it cost. It does not answer the question leadership is actually asking, which is whether the tool reached the people it was bought for.
The gap between those two is not theoretical. Running this against our own organization, the provider's Claude Code usage report returned rows for a small minority of the seats we had provisioned across a 35-day window, and several people we knew were using the tool daily - including the organization owner - produced no rows at all. Adoption calculated from usage alone would have read as a failed rollout. The rollout was fine; the reporting was partial.
"An adoption percentage is a fraction. Most AI tool reporting gets the numerator from the provider and then invents the denominator."
🔥 Our Take
Most AI ROI dashboards are confident about a number nobody can actually observe. We would rather show you the hole in the data than paper over it with an average.
The industry is shipping AI adoption scores built on usage reporting that is known to be partial, and per-developer AI leaderboards built on commit trailers that miss every inline completion. Both look authoritative in a board deck. Neither survives being asked how the denominator was obtained. If a vendor cannot tell you what their coverage is, the number they are showing you is not adoption - it is the subset of adoption their integration happened to see.
What Should You Actually Track?
Four things, in this order. The first two are about the rollout, the second two about whether it changed anything.
| Measure | Question it answers | Watch out for |
|---|---|---|
| Seat coverage | How much of what we pay for can we see at all? | This is a data-quality reading first, an adoption reading second |
| Confirmed active identities | Who is definitely using it? | One human is often several identities |
| Spend by channel | Where is the money going? | Seat, metered and API key are not comparable, do not sum them |
| Delivery change | Did anything actually get faster or safer? | Needs a before baseline, which most rollouts forget to take |
"Tokens spent is an activity metric wearing a cost metric's clothes. It tells you the tool was used, not that it helped."
Why Does One Engineer Show Up as Several People?
This surprises everyone the first time. A single engineer can legitimately appear as a subscription seat under their work email, plus a separate identity for every API key they have created for a service. To the provider these are unrelated actors. To your cost report they look like several people, and to a naive headcount they inflate adoption.
The fix is an explicit identity mapping rather than name matching. Name matching is specifically unsafe here: an API key's name is a mutable label, so matching on it lets a key that was deleted and recreated inherit the previous owner's attribution and spend, silently and with no correction path. Mapping should key on identifiers the provider guarantees are stable.
📊How CodePulse Reports This
The AI ROI page is built around the coverage problem rather than around a single adoption score:
- A seat roster as the denominator. Provisioned seats are pulled from the provider's admin API and kept as their own record, so coverage can be reported instead of assumed
- An explicit coverage notice. When reported usage covers fewer identities than the roster, the shortfall is shown rather than absorbed into the percentage
- Channels kept separate - subscription seat, metered and API key usage are distinguished rather than summed into one misleading total
- Identity mapping you confirm once. Confirming one identity for a person teaches the matcher their other identities, and reversing a decision unwinds what it propagated
- AI-assisted PR share, labelled as a floor. Detection reads commit co-author trailers, so agentic tools are visible and inline completions are not. It is presented as "what we can identify", never as total AI usage
How Do You Prove It Changed Anything?
Adoption is the easy half. The question that decides renewal is whether delivery improved, and that cannot be answered from the AI tool's own telemetry at all - the tool knows how much it was used, not what happened to the work afterwards.
Compare the same delivery measures before and after the rollout, from version control rather than from the assistant. Cycle time and its phases, review turnaround, and the rate at which merged work gets reverted are the useful three: the first two show whether things sped up, the third shows whether that speed cost you stability. Our cycle time breakdown guide covers what to capture.
"The tool can tell you it was used. Only your delivery data can tell you it was worth it."
The common failure is having no before. If a rollout is imminent, take the baseline this week, because the comparison is impossible to reconstruct afterwards and "it feels faster" will not survive a budget review.
On the tool-choice question that usually precedes all of this, our Claude Code vs GitHub Copilot comparison covers the fit differences, and AI code review tools covers the review-side tooling that often lands alongside it. And if you want Claude itself to answer questions about your delivery data, the Claude MCP for engineering metrics guide covers the setup.
Frequently Asked Questions
There are two independent sources and you need both. The provider reports usage - which identities ran sessions and what they spent. The provider also has a seat roster - who you are paying for. Usage alone tells you what happened; the roster tells you what the denominator is. Comparing the two is the only way to know whether low reported adoption is real or just incomplete reporting.
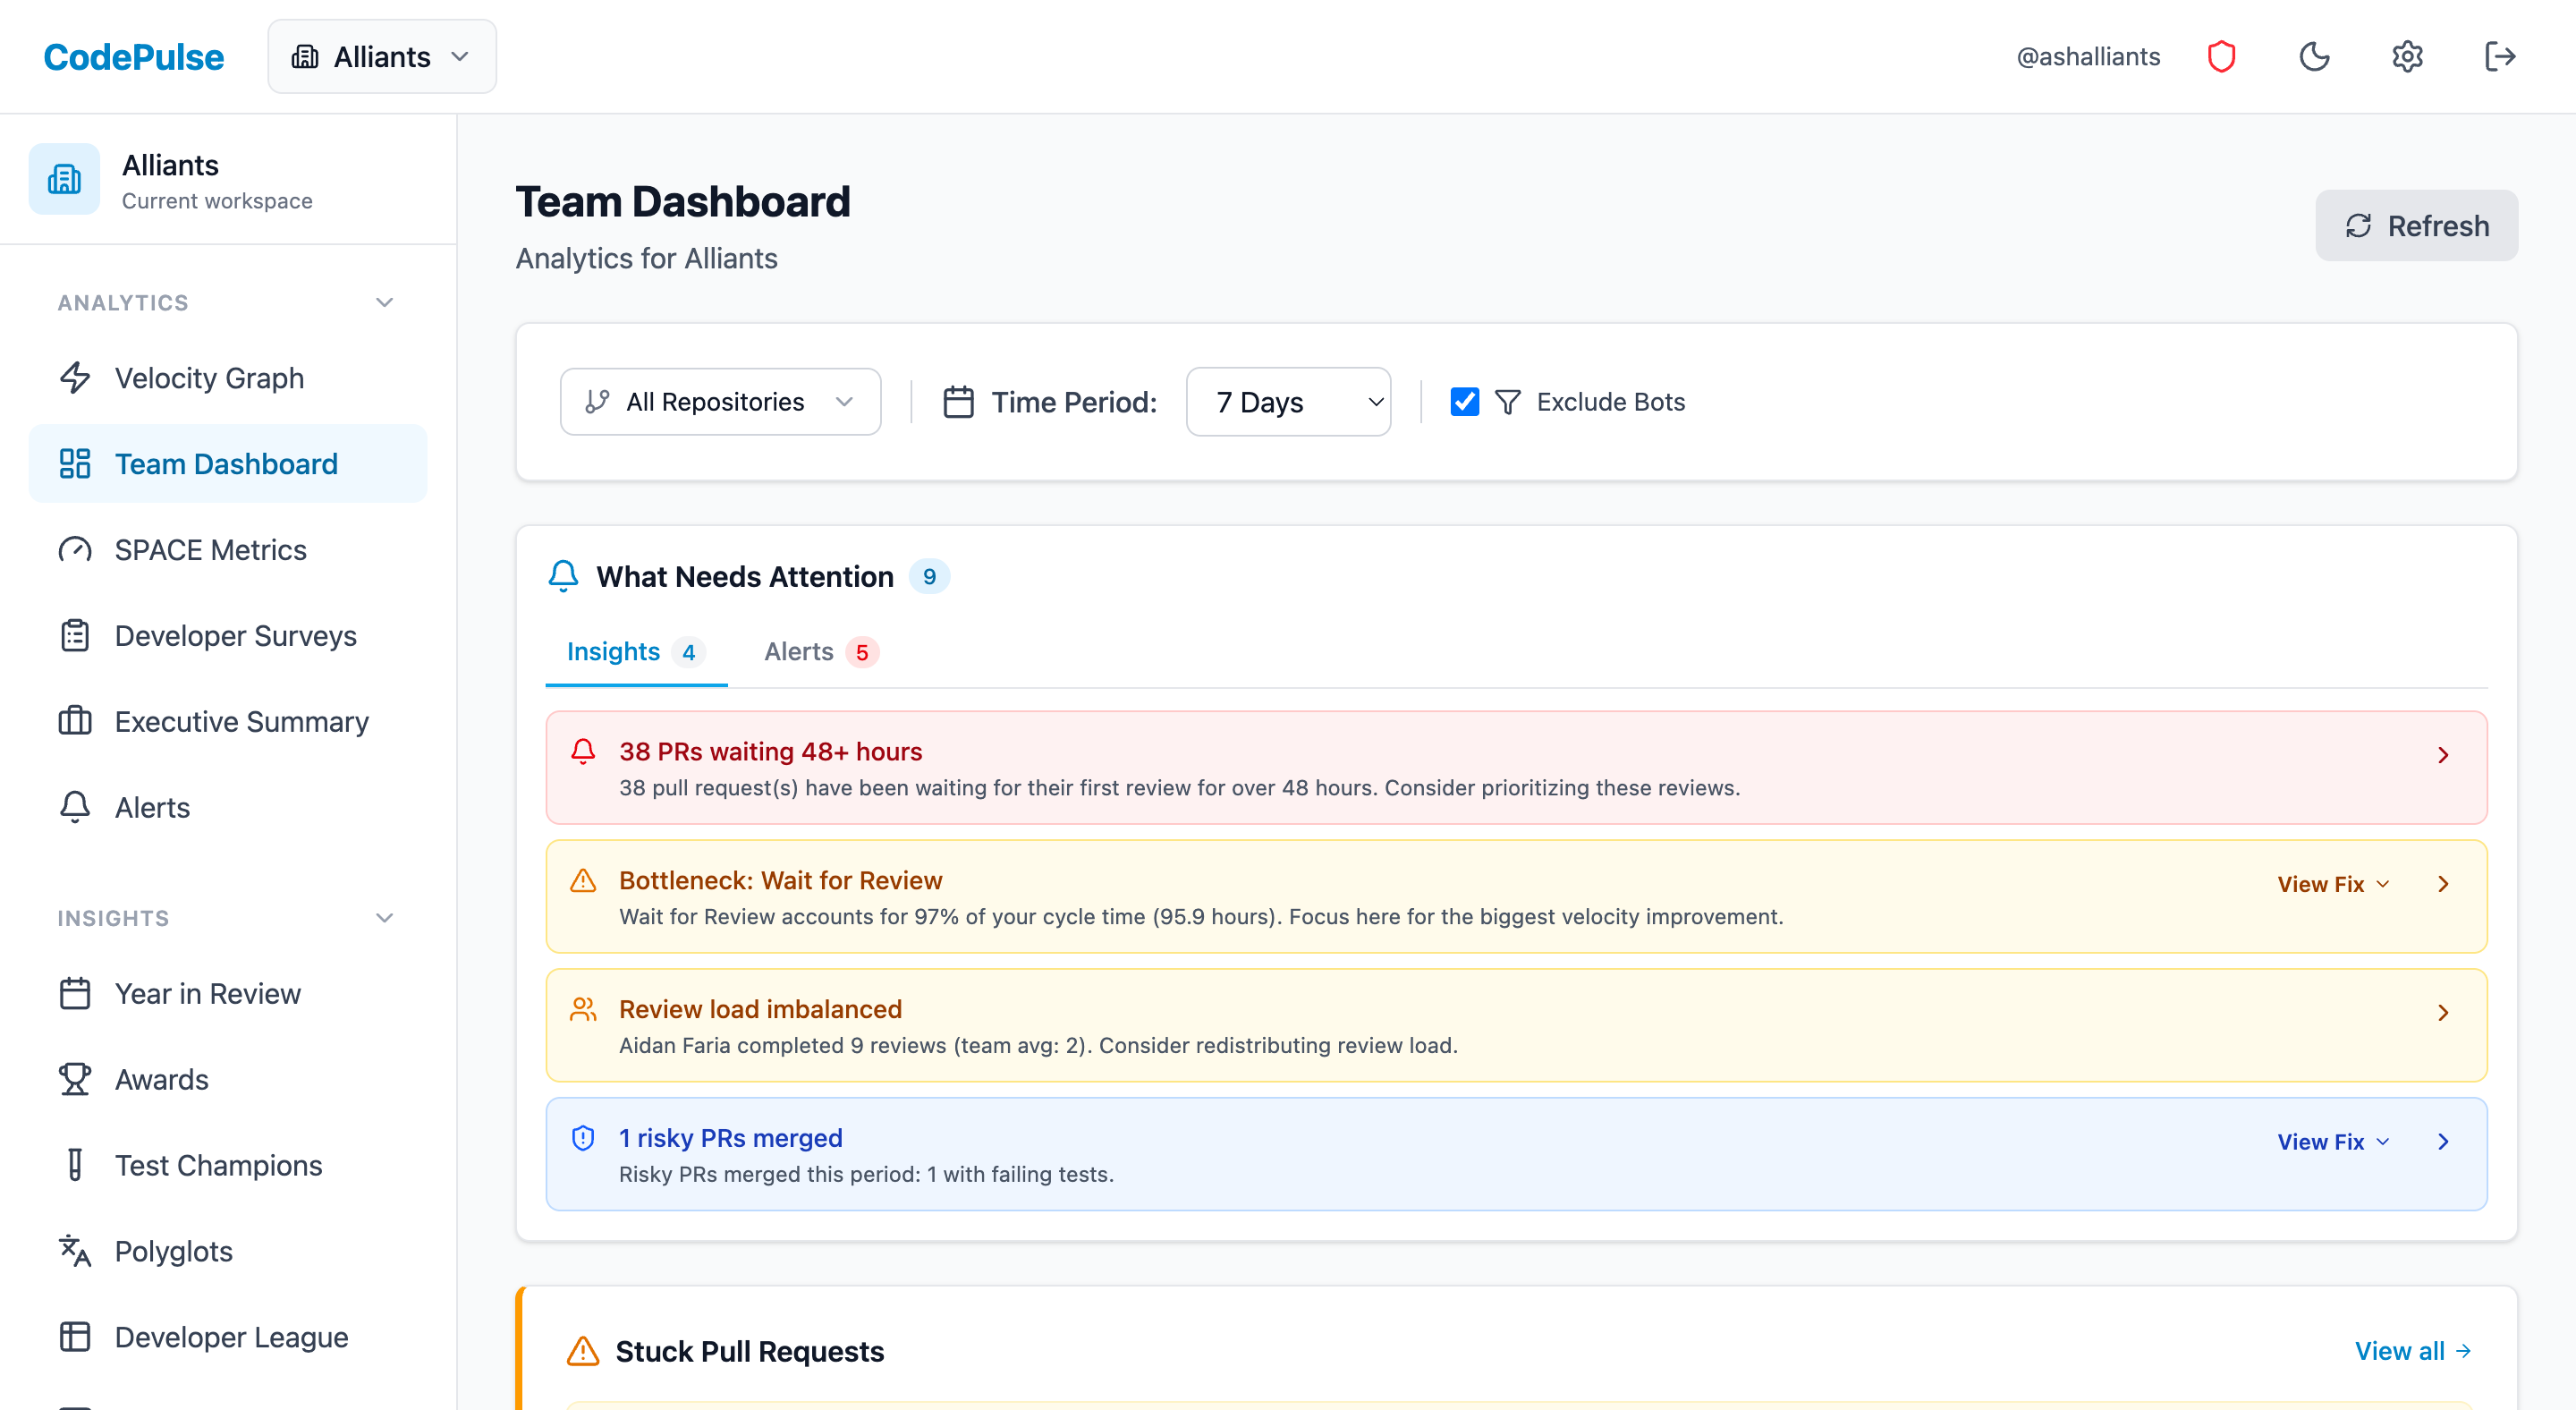
Now measure this metric on your own repositories
Connect read-only GitHub in about five minutes and get your baseline, your trend, and the constraint behind it. Your fourteen usable trial days start when the first repository finishes syncing.
Read-only GitHub · Your code stays yours · Team-level by default · No credit card
See These Features in Action
Explore all featuresRelated Guides
AI Coding Tools: What Actually Changed After 6 Months
Measure the real impact of AI coding tools like Copilot and Cursor on your engineering team. Data-driven framework using cycle time, code churn, and review metrics.
Claude Code vs GitHub Copilot: Which Fits? (2026)
Copilot CLI went GA in February 2026, so both tools now run a terminal agent. A head-to-head on what actually differs: model choice, AI Credits vs a Claude plan, GitHub depth, and surface spread.
AI Code Review Tools: Which Actually Save Time (2026 Tests)
We tested 8 AI code review tools to see which caught real bugs, which added noise, and the metrics that prove whether they work for your team.
The 4-Minute Diagnosis That Reveals Why Your PRs Are Stuck
Learn to diagnose exactly where your PRs are getting stuck by understanding the 4 components of cycle time and how to improve each one.
Engineering Analytics ROI: The Budget Approval Playbook
Calculate the ROI of engineering analytics tools with formulas for time savings, payback period, and a business case template tailored to CFOs, CTOs, and CEOs.