
Compare the finished analysis before you choose a platform
See the report CodePulse produces from read-only GitHub workflow data, or connect your own repositories and evaluate the fit with real evidence.
Read-only GitHub · Your code stays yours · Team-level by default · No credit card
Jellyfish and Allstacks both sell investment allocation as their headline use case, but they answer different questions. Jellyfish maps engineering work to strategic priorities for finance and product stakeholders; Allstacks maps engineering time to planned initiatives and automates R&D capitalization reporting. Neither publishes self-serve pricing, and third-party estimates put Jellyfish contracts at $30,000-$60,000 a year for a 50-200 engineer team. If you want a flat-priced, GitHub-native option instead of an enterprise procurement cycle, CodePulse fits a narrower slice of the same problem.
Jellyfish vs Allstacks for investment allocation: which should you pick?
Pick Jellyfish if your buyer is finance or the executive team and you need engineering spend mapped to OKRs, product areas, and AI investment. Pick Allstacks if you need audit-ready R&D capitalization without timesheets, plus delivery forecasting. Both are enterprise, sales-led products priced for 100+ engineer organizations. If you are under 200 engineers, GitHub-native, and want work-type categorization without a multi-week sales cycle, CodePulse is the third option worth evaluating.
Both products emerged from the same category: engineering intelligence platforms that turned Git and issue-tracker data into a story finance teams could understand. But "investment allocation" means something slightly different at each company, and that difference should drive your evaluation more than a feature checklist will.
Neither Jellyfish nor Allstacks lists a price on its website. If a vendor will not tell you what a seat costs before a demo call, budget for a sales cycle, not a signup form.
What Do Jellyfish and Allstacks Actually Do?
Jellyfish positions itself as an engineering intelligence platform for aligning engineering output with business strategy. Its homepage describes a "Resource Allocations" capability under a Business Alignment banner, framed as the ability to see how engineering allocation maps to strategic priorities and rebalance work as goals shift. It ingests commits and pull requests from Git, tasks from Jira and Linear, and contextual business data from planning tools. Jellyfish has also expanded into AI investment tracking, publishing AI spend, token usage, and adoption data alongside its existing allocation views.
Allstacks positions itself around value stream intelligence: delivery forecasts, risk and bottleneck alerts, and traceability from business initiatives down to individual commits and pull requests. Its homepage leads with two specific claims: aligning investment to initiatives ("where engineering time goes to what's actually planned") and automating software cost capitalization into audit-ready reports "no timesheets" required. That capitalization angle is Allstacks' sharpest differentiation from Jellyfish, which frames allocation around strategic alignment rather than accounting compliance.
In other words: Jellyfish's allocation story is aimed at the strategy conversation ("are we investing in the right things"), while Allstacks' allocation story is aimed at the finance conversation ("can we prove what we spent, without timesheets, for an audit"). Both integrate with GitHub, GitLab, and Jira-family tools; both require an annual, sales-negotiated contract; neither publishes a self-serve trial.
How Do They Compare on Investment Allocation?
Every investment-allocation tool, regardless of vendor, has to answer the same three questions before a VP of Engineering can trust the number on a board slide. We call this the Allocation Lens:
| Allocation Lens Question | Why It Matters |
|---|---|
| 1. Where did engineering time actually go? | The raw signal: PRs, commits, and issues bucketed into categories like feature work, maintenance, tech debt, and infrastructure. |
| 2. How confident is the categorization? | Automated classification is never 100% right. The question is whether a human can see and fix the uncertain cases before the number goes to the board. |
| 3. Can finance actually consume it? | Strategic alignment and capitalization reporting have different consumers and different accuracy bars. A finance-grade number needs an audit trail; a strategy-grade number needs to be directionally right and easy to explain. |
Run Jellyfish and Allstacks through the lens and the split holds. Jellyfish answers question 3 with strategic alignment: allocation feeding OKR and roadmap conversations, not a capitalization ledger. Allstacks answers question 3 with an accounting deliverable: automated, audit-ready capitalization reports built to remove timesheets from the process entirely. Neither vendor's public marketing details exactly how question 2 (categorization confidence) is surfaced to end users, which is worth asking directly in a demo before you commit to a multi-year contract on the strength of a dashboard screenshot.
An allocation number nobody can audit is just an opinion with a pie chart around it.
How Do Jellyfish and Allstacks Price?
Jellyfish does not publish pricing anywhere on its site; the only path to a number is a demo request. Independent pricing research puts contracts for 50-200 engineer organizations at roughly $30,000-$60,000 in annual recurring revenue, climbing past $60,000-$100,000 for 200-500+ engineer organizations, with pricing typically calculated per engineering seat per year and annual-only contracts (no monthly option).
Allstacks does publish tiered pricing on its pricing page: Premium runs $400 per contributor per year for organizations up to 500 contributors, and Enterprise runs $600 per contributor per year for 101+ contributors with no published upper limit. A standalone R&D Capitalization tier is priced separately at $200 per contributor per year for unlimited contributors, and is SOC 1 certified. Volume discounts apply at larger contributor bands.
| Aspect | Jellyfish | Allstacks | CodePulse |
|---|---|---|---|
| Primary use case | Strategic alignment: allocation vs. OKRs and roadmap | Delivery forecasting + R&D capitalization | Work-type categorization + cycle time + review analytics |
| Investment/allocation method | Maps commits, PRs, and issues to business categories and objectives | Maps engineering time to planned initiatives; auto-generates capitalization reports | Classifies PRs into feature, bug fix, maintenance, tech debt, infrastructure, and support, with manual and bulk reclassification |
| Pricing model | Not published; per-seat, sales-negotiated | Published, per contributor per year | Flat rate per organization, not per seat |
| Min. contract | Annual only; est. $30,000+/year | Annual; $400-600/contributor/year published tiers | Free tier available; Pro $199/month ($1,788/year billed annually) |
| GitHub depth | Supported alongside GitLab, Bitbucket, Azure Repos | Supported alongside GitLab and Jenkins | GitHub-native only: PRs, files, reviews, commits |
| Setup | Sales-led, no public self-serve trial | Sales-led, no public self-serve trial | Self-serve, minutes to first data |
Neither Jellyfish's nor Allstacks' public pages state their onboarding timeline or data-sync frequency in enough detail to cite responsibly here. If either metric matters to your decision, ask for it directly in the sales process and get it in writing before you sign.
Which Integrations Does Each Support?
Jellyfish's public integration list covers version control (Git, GitHub, GitLab, Bitbucket, Azure Repos), issue tracking (Jira, Linear, Azure Boards, Productboard), AI coding tools (GitHub Copilot, Claude, Amazon Q, Google Gemini), and operational tools (Jenkins, CircleCI, PagerDuty, Slack). Allstacks' public pages mention GitHub, GitLab, and Jenkins. Third-party coverage of Allstacks also lists Bitbucket, Azure DevOps, and Jira support, but the current allstacks.com marketing pages do not enumerate every connector in the same depth as Jellyfish's site.
Both vendors integrate broadly across source control and project management, which fits their target buyer: a VP of Engineering or CTO managing a multi-tool estate across GitHub, Jira, and several CI/CD systems at once. Neither is GitHub-only, and neither markets file-level or review-network depth as a differentiator. That granularity is what a broad-coverage tool trades away in exchange for supporting every stack a large enterprise might run.
Which Should You Choose?
| Your Situation | Recommendation |
|---|---|
| Your board asks whether engineering spend matches the stated roadmap and OKRs | Jellyfish |
| You need audit-ready R&D capitalization reports without timesheets | Allstacks |
| You want a self-serve trial instead of a multi-week sales cycle | CodePulse |
| You run a heterogeneous stack (GitLab, Bitbucket, Azure DevOps, multiple issue trackers) | Jellyfish or Allstacks |
| You are GitHub-only, under 200 engineers, and want a flat annual price | CodePulse |
| Per-contributor pricing you can see in advance matters more than the deepest feature set | Allstacks (published tiers) over Jellyfish (sales-only) |
* Our Take
There is no "best" engineering analytics tool. There is the tool that makes the right trade-offs for your situation.
CodePulse is great for GitHub-focused teams who want depth without integration complexity. It is the wrong choice if you need R&D capitalization compliance, multi-tool source control support, or OKR-level strategic alignment reporting for a board that expects that vocabulary. If your organization runs 300 engineers across GitHub, GitLab, and Jira and finance needs a capitalization report every quarter, Allstacks or Jellyfish is doing a job CodePulse does not attempt. Comparison guides that pretend otherwise are propaganda, not analysis, and trust is worth more than a conversion from the wrong customer.
Where Does CodePulse Fit?
CodePulse is not a drop-in replacement for either tool. It does not do R&D capitalization, OKR mapping, or delivery forecasting. What it does is a narrower, GitHub-native version of the same allocation question: where did engineering time actually go, broken down by pull request rather than by a rolled-up strategic category.
* How to See This in CodePulse
Navigate to Investment Allocation to see the breakdown:
- PRs are automatically classified into feature, bug fix, maintenance, tech debt, infrastructure, and support categories
- Uncategorized PRs are surfaced in a dedicated queue, with one-click and bulk reclassification so a human can catch what the model gets wrong before the number reaches a board deck
- Set investment targets per category and track actual allocation against them
- Export the breakdown as CSV for a board deck or finance review
For a broader executive view, the executive summary pairs allocation with cycle time and health-grade context on a single page you can export for a leadership meeting, without a professional-services engagement to configure it. The allocation categories are visible and editable on every pull request, which addresses the second Allocation Lens question directly: nothing in the number is a black box.
The fastest way to lose trust in an allocation dashboard is to hide how a PR got its category.
CodePulse is priced flat per organization rather than per contributor, starting with a free tier and a Pro plan at $199 a month, or $1,788 a year billed annually. That is a materially different cost curve than $400-$600 per contributor per year at Allstacks, or an estimated $30,000+ annual Jellyfish contract, but it buys a narrower product: no capitalization automation, no OKR mapping, and GitHub only. If your organization needs those specific capabilities, that price gap is not a bargain, it is the cost of the features you would be giving up.
For deeper reading on each vendor individually, see our Jellyfish alternatives guide and Allstacks alternatives guide, or the full engineering analytics tools comparison for how they stack against LinearB, Swarmia, and the rest of the category. If your board wants the KTLO-vs-innovation framing without the enterprise price tag, our KTLO vs innovation investment profile guide walks through how to categorize and present that split to executives.
If you want to see your own allocation breakdown before deciding on anything, start a free CodePulse trial. You will see real categorized PR data from your repositories in minutes, not after a demo call and a follow-up proposal.
Frequently Asked Questions
Jellyfish is the stronger pick for that exact brief: its Allocations product maps Jira epics and GitHub activity to strategic initiatives and roadmap commitments, and its board reporting speaks CFO. Allstacks counters with ML delivery forecasting and Section 174 capitalization. If the requirement is allocation depth tied to Jira hygiene, choose Jellyfish; if it is schedule-risk prediction, choose Allstacks. Teams of 50-500 that mainly need work-type visibility get the same six-category allocation from CodePulse at a flat $199/month without the enterprise contract.
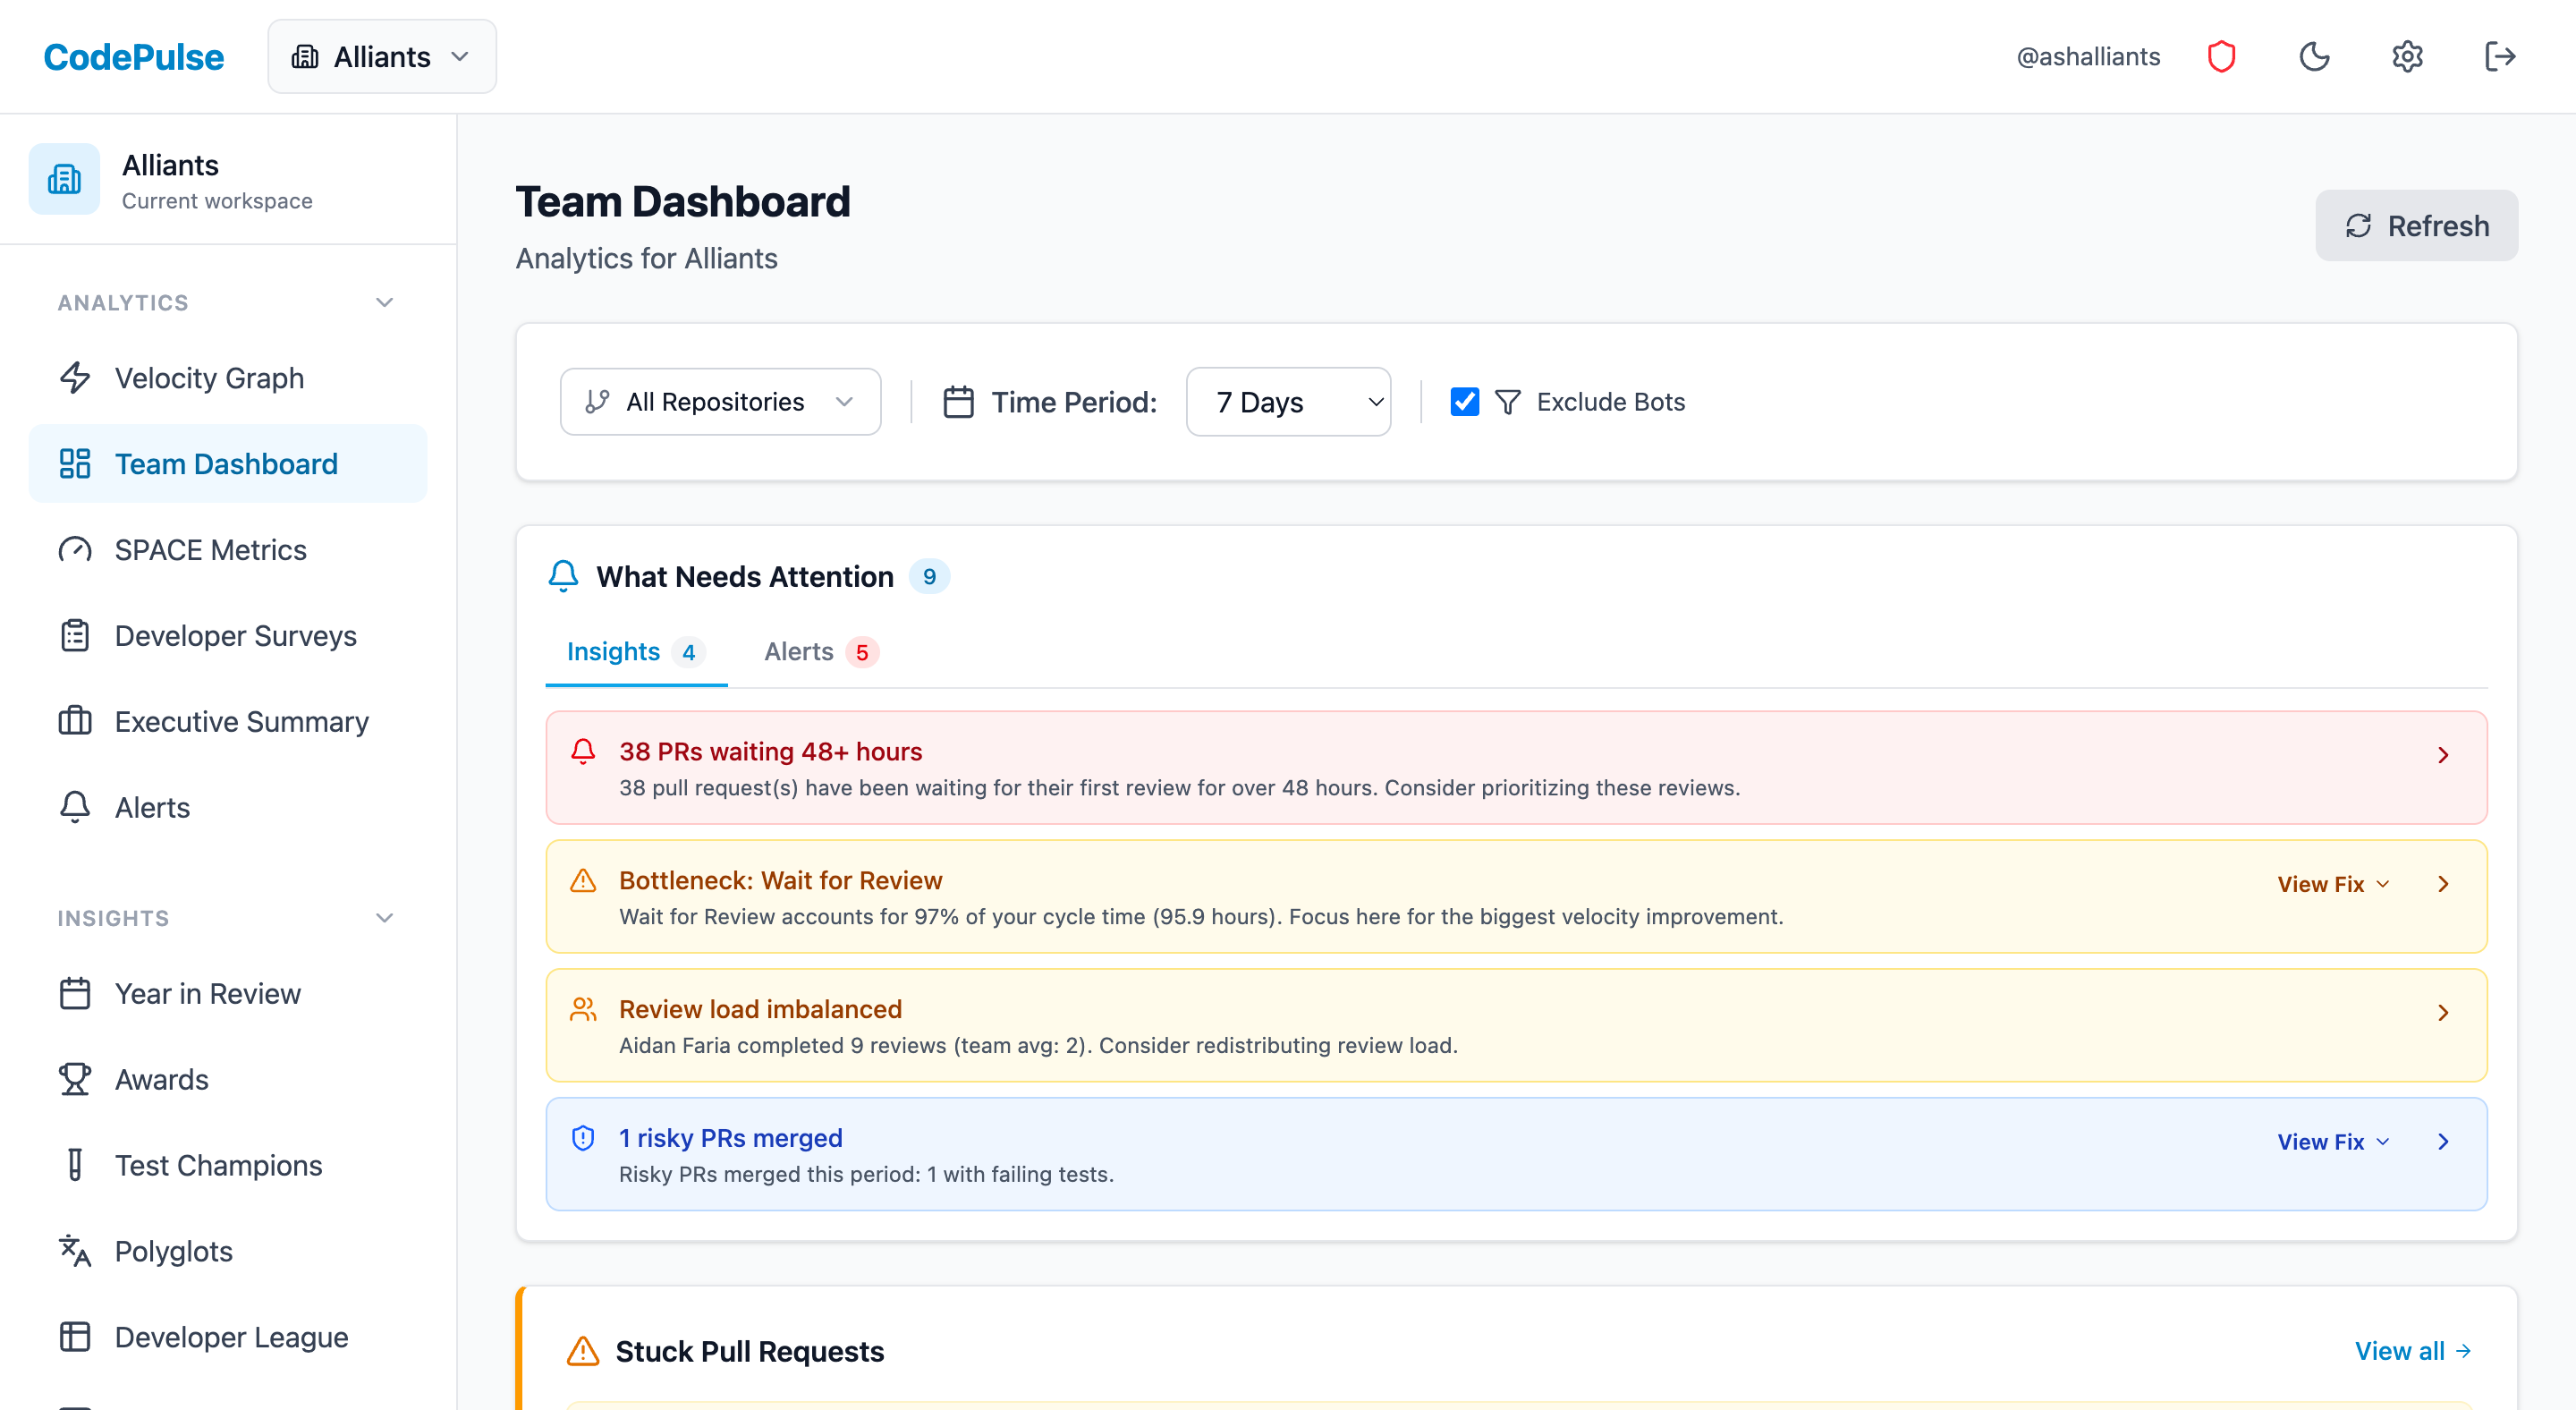
Evaluate CodePulse against your own delivery history
A comparison table only goes so far. Connect read-only GitHub in about five minutes and judge the output on your repositories, at one flat price, with no per-seat math.
Read-only GitHub · Your code stays yours · Team-level by default · No credit card
See These Features in Action
Explore all featuresRelated Guides
7 Jellyfish Alternatives for 2026 (Honest Ranking)
Compare 7 Jellyfish alternatives including CodePulse, LinearB, Swarmia, and more. Honest pros, cons, pricing, and integration comparisons.
7 Best Allstacks Alternatives for Engineering Teams (2026)
An honest comparison of 7 Allstacks alternatives. Covers pricing, delivery forecasting trade-offs, integration depth, and when Allstacks is still the right choice.
Jellyfish vs LinearB vs Swarmia: Full 2026 Comparison
Compare Jellyfish, LinearB, Swarmia, Allstacks, Haystack and more engineering analytics tools. Features, pricing, cycle time benchmarks, and integrations.
The Slide That Changed How Our Board Sees Engineering
Stop talking about "maintenance" and start talking about "investment." How to measure and present your engineering investment profile to the board.