

Turn this metric into a baseline for your team
Preview a system-level engineering health report, then connect GitHub when you are ready to compare this metric with your own delivery history.
Read-only GitHub · Your code stays yours · Team-level by default · No credit card
Your team ships code every day, yet leadership still asks the same question: is any of this turning into value? Flow metrics answer that by tracking how work moves through your delivery system instead of how busy each person looks. They are the closest thing to an economic dashboard for engineering.
What are flow metrics and what are the five of them?
Flow metrics are five system-level measurements from the Flow Framework that track how work moves through a software delivery value stream. They originate with Dr. Mik Kersten's 2018 book "Project to Product" and focus on business value delivery rather than individual output. The five are: Flow Velocity (how many work items finish in a period), Flow Time (how long a work item takes from acceptance to release), Flow Efficiency (active work time as a share of total time), Flow Load (how much work is in progress at once), and Flow Distribution (the mix of features, defects, debt, and risk).
This guide walks through where flow metrics came from, what each of the five actually tells you, how they differ from DORA, and - the part most articles skip - how to read them straight from your GitHub pull request data without buying a heavyweight portfolio tool first.
🔥 Our Take
Flow metrics diagnose a system. The moment you turn them into individual scorecards, you break them. The whole point of the Flow Framework is that value gets stuck in the gaps between people - in queues and handoffs - so pinning a low number on one engineer misreads what the data is telling you.
When Flow Efficiency comes back at 18%, that points at a system where work spends most of its life waiting, well before it says anything about how hard the team works. Fix the waiting and the numbers move. Grade the individuals and you will get gamed metrics and a team that hides its real bottlenecks.
What Are Flow Metrics?
Flow metrics are a set of measurements that track how work moves through a value delivery system, from the moment an idea is accepted until a customer can use it. Rather than counting activity like commits or lines of code, they measure the flow of business value: how fast work finishes, how long it takes end to end, how much of that time is productive, how much work is open at once, and what kind of work you are actually doing.
The framing matters. A utilization metric asks "are our people busy?" A flow metric asks "how quickly does value reach the customer?" Those two questions often pull in opposite directions. A team running at 100% utilization tends to build long queues, and queues are where flow time quietly balloons. That is why flow metrics have caught on with engineering leaders who got burned by activity dashboards that looked healthy while delivery crawled.
"High utilization and fast delivery are usually enemies. The busiest teams build the longest queues, and queues are invisible on an activity dashboard."
Where Did the Flow Framework Come From?
The Flow Framework was formalized by Dr. Mik Kersten in his 2018 book Project to Product. Kersten had watched large enterprises pour money into Agile and DevOps and still fail to show leadership how any of it produced business outcomes. His answer was to borrow from lean manufacturing - specifically value stream mapping, which Toyota popularised decades earlier - and apply it to the flow of software work.
Before you can measure flow, you have to define what is flowing. The framework sorts all work into four flow items, each carrying business meaning:
- Features - new value delivered to customers through new or changed code.
- Defects - fixes for quality problems that hurt the customer experience.
- Debt - work that improves the software and operational architecture so future delivery stays healthy.
- Risk - security, privacy, compliance, and governance work.
This is the quiet innovation of the framework. By labelling every unit of work as one of these four, you can finally answer questions the business cares about, like "what share of last quarter went to paying down debt versus shipping features?" That question sits at the heart of Flow Distribution, which we get to below. The approach shares its roots with value stream mapping for software teams, so if you have done VSM the mental model will feel familiar.
What Are the Five Flow Metrics?
There are five core flow metrics, and each one asks a different question about how value moves through your system. They are deeply intertwined - you cannot read one in isolation and expect the full story - but here is what each measures and what it tells you.
| Flow Metric | What It Measures | What It Tells You |
|---|---|---|
| Flow Velocity | Number of flow items completed in a given time window. | Whether throughput is rising, flat, or falling as you change how the team works. |
| Flow Time | Elapsed time from a work item being accepted until it reaches production. | How responsive you are to a request end to end, including all the waiting. |
| Flow Efficiency | Active work time divided by total flow time, shown as a percentage. | How much of a work item's life is real progress versus sitting in a queue. |
| Flow Load | Total work in progress across the value stream at a point in time. | Whether you have taken on more than the system can finish without stalling. |
| Flow Distribution | Proportional mix of features, defects, debt, and risk. | Whether your effort matches business priorities, or debt is quietly starving features. |
A quick word on how these connect. Flow Load and Flow Time obey Little's Law: if velocity holds steady and you pile on more work in progress, flow time stretches in proportion. That is the mathematical reason work-in-progress limits speed up delivery. Teams that cut their Flow Load - finishing what they started before pulling in more - often see Flow Time drop without adding a single person.
"Starting more work rarely gets things done faster. Little's Law explains why: pile on work in progress with velocity fixed, and every item takes longer to finish."
Some organizations add a sixth metric. The Scaled Agile Framework introduced flow metrics as a first-class practice and included Flow Predictability, which compares planned business value against what actually shipped. For most engineering teams the original five are plenty to start with.
How Do Flow Metrics Differ From DORA?
DORA and flow metrics answer different questions, which is why mature teams often track both. DORA measures the speed and stability of software delivery through four keys: deployment frequency, lead time for changes, change failure rate, and time to restore service. Flow metrics sit one level up and ask whether that delivery is producing business value across the whole value stream.
The clearest way to see the difference is Flow Time versus DORA lead time. DORA's lead time for changes usually starts at code commit and ends at deploy. Flow Time starts when a work item is accepted - long before anyone writes code - and ends when it is released to customers. So Flow Time captures the planning and prioritisation delay that DORA never sees, which is often where the real waiting hides.
| Dimension | DORA Metrics | Flow Metrics |
|---|---|---|
| Question answered | How fast and stable is delivery? | Does delivery create business value? |
| Scope of the clock | Commit to deploy | Idea accepted to released |
| Audience | Engineering and platform teams | Product and portfolio leaders |
| Work classification | Not built in | Features, defects, debt, risk |
In short: DORA tells you how healthy your delivery pipeline is, and flow metrics tell you whether that pipeline is pointed at the right work. If you are choosing between measurement systems, our DORA metrics guide covers the four keys in depth, and the SPACE framework guide adds the human dimension that neither DORA nor flow captures on its own.
How Do You Read Flow Metrics From GitHub Data?
Here is where most flow metrics articles quietly assume you have a portfolio tool wired into Jira with clean workflow states. Plenty of teams do not, and they can still get four of the five metrics from data that already lives in GitHub. Pull requests and commits carry timestamps for when work started, when it waited, and when it merged, which is most of what you need.
Here is a practical mapping from GitHub signals to flow metrics:
- Flow Velocity - count merged pull requests per week or month, grouped by work type. It is a proxy for completed flow items, and it trends the same way.
- Flow Time - measure from the first commit or issue link to the merge or deploy. For a fuller picture, extend the start back to when the linked issue was accepted.
- Flow Efficiency - break the pull request lifecycle into active phases (coding, review) and wait phases (waiting for review, waiting to merge), then divide active time by the total.
- Flow Load - count open pull requests and in-progress branches at any moment. A climbing count is a warning that the team has started more than it can finish.
- Flow Distribution - this is the one that needs classification. Tag each pull request as feature, defect, debt, or risk using labels or automated work-type detection.
Flow Distribution is the piece GitHub cannot give you for free, because a merged PR does not announce whether it shipped a feature or paid down debt. That is a solvable labelling problem, and it is worth solving, because Flow Distribution is often the metric that changes an executive conversation.
💡Flow Efficiency From Your PR Data
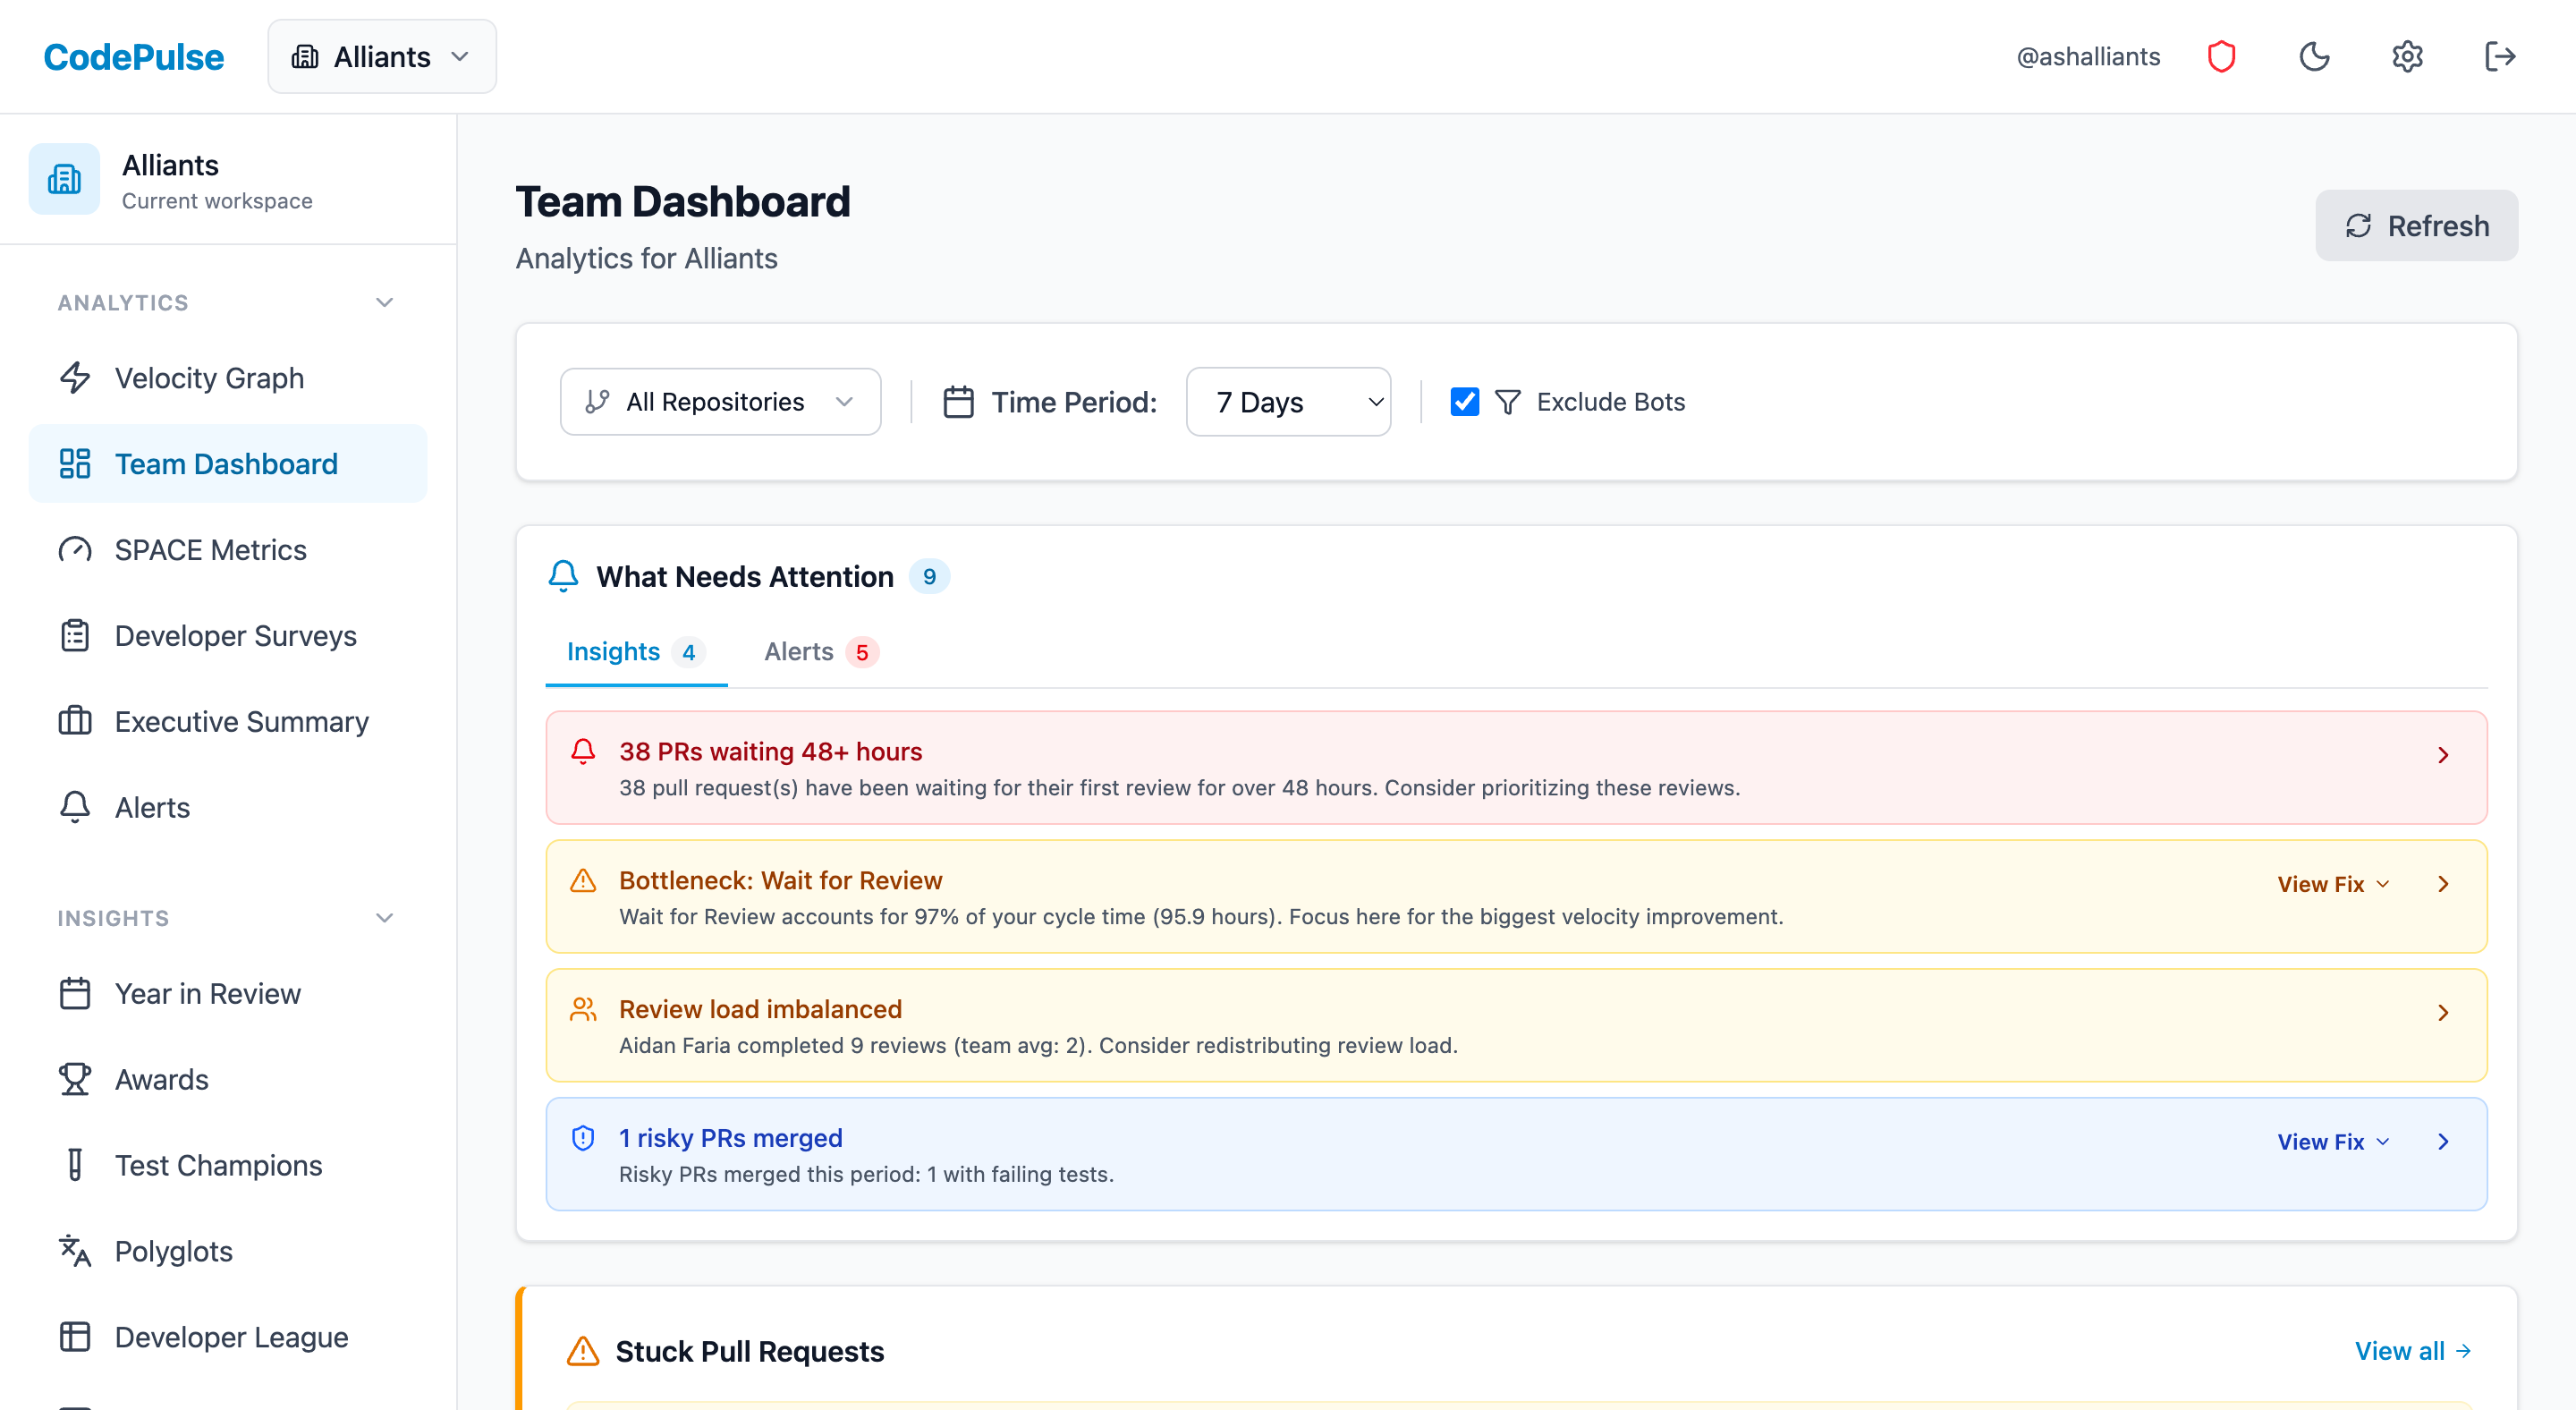
CodePulse already breaks every pull request into active and waiting phases, which is exactly the split Flow Efficiency needs. Its cycle time breakdown separates coding, waiting for review, in review, and merge time, so you can see where work actually sits idle - all read straight from GitHub, no Jira portfolio required.
- Coding and review time count as active work.
- Waiting for review and waiting to merge count as wait states.
- Work-type tagging turns merged PRs into Flow Distribution.
If you want to dig into the phase breakdown that powers this, our cycle time breakdown guide explains how each phase is measured and where teams usually find the biggest wait.
Why Does Flow Efficiency Expose So Much Waste?
Flow Efficiency is the metric that surprises people, because the number is almost always lower than anyone expects. The formula is simple: active work time divided by total flow time, expressed as a percentage. When teams measure it for the first time, the result tends to be far lower than they'd guess, because a work item spends most of its life waiting in queues rather than being actively worked on.
Sit with that for a second. For example, a Flow Efficiency of 20% means a work item is actively worked on for one day out of every five it exists. The other four days it is waiting - for review, for a decision, for a dependency, for a deploy window. All of that waiting is invisible on a traditional activity dashboard, which is why teams that feel slow often cannot explain why.
The developmental read on this is freeing. A low Flow Efficiency is a statement about the system: work waits because the process makes it wait, and that is a management problem you can fix without asking anyone to type faster. Shorten the review queue and cut the number of parallel initiatives, and the active share climbs on its own. That is the same lever we cover in how to reduce PR cycle time.
"When work items spend four days waiting for every one day of real progress, the queue is the bottleneck. Shorten the queue and the number moves."
How Do You Start Tracking Flow Metrics Without a Portfolio Tool?
You do not need to buy an enterprise value stream platform to get value from flow metrics. Start small, measure a baseline, and expand once the signal proves useful. Here is a sequence that works for a single team.
- Pick one team and one value stream. Flow metrics are misleading when averaged across unrelated teams. Measure one delivery pipeline first.
- Measure Flow Time and Flow Load from GitHub. These need only pull request and branch timestamps, so you can get a baseline this week.
- Add Flow Efficiency next. Split each PR into active and wait phases. This is the metric that usually triggers the "oh, that's the problem" moment.
- Introduce work-type labels for Flow Distribution. Agree on four labels - feature, defect, debt, risk - and apply them at PR open. Automated classification helps once volume grows.
- Review the trend rather than the absolute number. There is no universal target for any flow metric. Watch whether your own numbers move in the right direction over a quarter.
The last point is the one to hold onto. Flow metrics reward teams that treat them as a shared experiment rather than a report card. When Flow Load drops and Flow Time follows, that is a win the whole team can see and own. When Flow Distribution shows debt eating 40% of capacity, that belongs in the next planning conversation, where the team can act on it, well away from anyone's performance review.
"Track the trend, not the trophy. A flow metric that moves in the right direction over a quarter beats a single impressive number you cannot repeat."
Flow metrics pair naturally with the delivery-speed work most teams are already doing. If you want to connect flow to the way you measure output without burning people out, our engineering velocity metrics guide shows how to keep speed and sustainability in the same view.
Related Guides
- DORA Metrics Guide - the four keys of delivery health, and how they complement flow.
- Cycle Time Breakdown Guide - the phase split that powers Flow Efficiency.
- Value Stream Mapping for Software Teams - the lean roots of the Flow Framework.
Frequently Asked Questions
Flow metrics are five system-level measurements from the Flow Framework that track how work moves through a software delivery value stream: Flow Velocity, Flow Time, Flow Efficiency, Flow Load, and Flow Distribution. They come from Dr. Mik Kersten's 2018 book "Project to Product" and measure business value delivery rather than individual activity.
Now measure this metric on your own repositories
Connect read-only GitHub in about five minutes and get your baseline, your trend, and the constraint behind it. Your fourteen usable trial days start when the first repository finishes syncing.
Read-only GitHub · Your code stays yours · Team-level by default · No credit card
See These Features in Action
Break down cycle time into coding, waiting, review, and merge phases.
Track all four DORA metrics and benchmark against industry standards.
Related Guides
DORA Metrics Explained: The 4 Keys Without the Hype
A complete breakdown of the four DORA metrics - deployment frequency, lead time, change failure rate, and MTTR - with honest benchmarks and gaming traps to avoid.
The 4-Minute Diagnosis That Reveals Why Your PRs Are Stuck
Learn to diagnose exactly where your PRs are getting stuck by understanding the 4 components of cycle time and how to improve each one.
Value Stream Mapping for Software Teams | Guide
Value stream mapping reveals that most lead time is waiting, not working. This guide shows how to map your software delivery flow, calculate flow efficiency, and identify the biggest improvement opportunities.
Why Microsoft Abandoned DORA for SPACE (And You Should Too)
Learn how to implement the SPACE framework from Microsoft and GitHub research to measure developer productivity across Satisfaction, Performance, Activity, Communication, and Efficiency.
Developer Velocity: Metrics Beyond Story Points
Measure developer and engineering velocity without story points: cycle time, deployment frequency, flow efficiency and sustainable pace, plus what DORA tracks today.