
Compare the finished analysis before you choose a platform
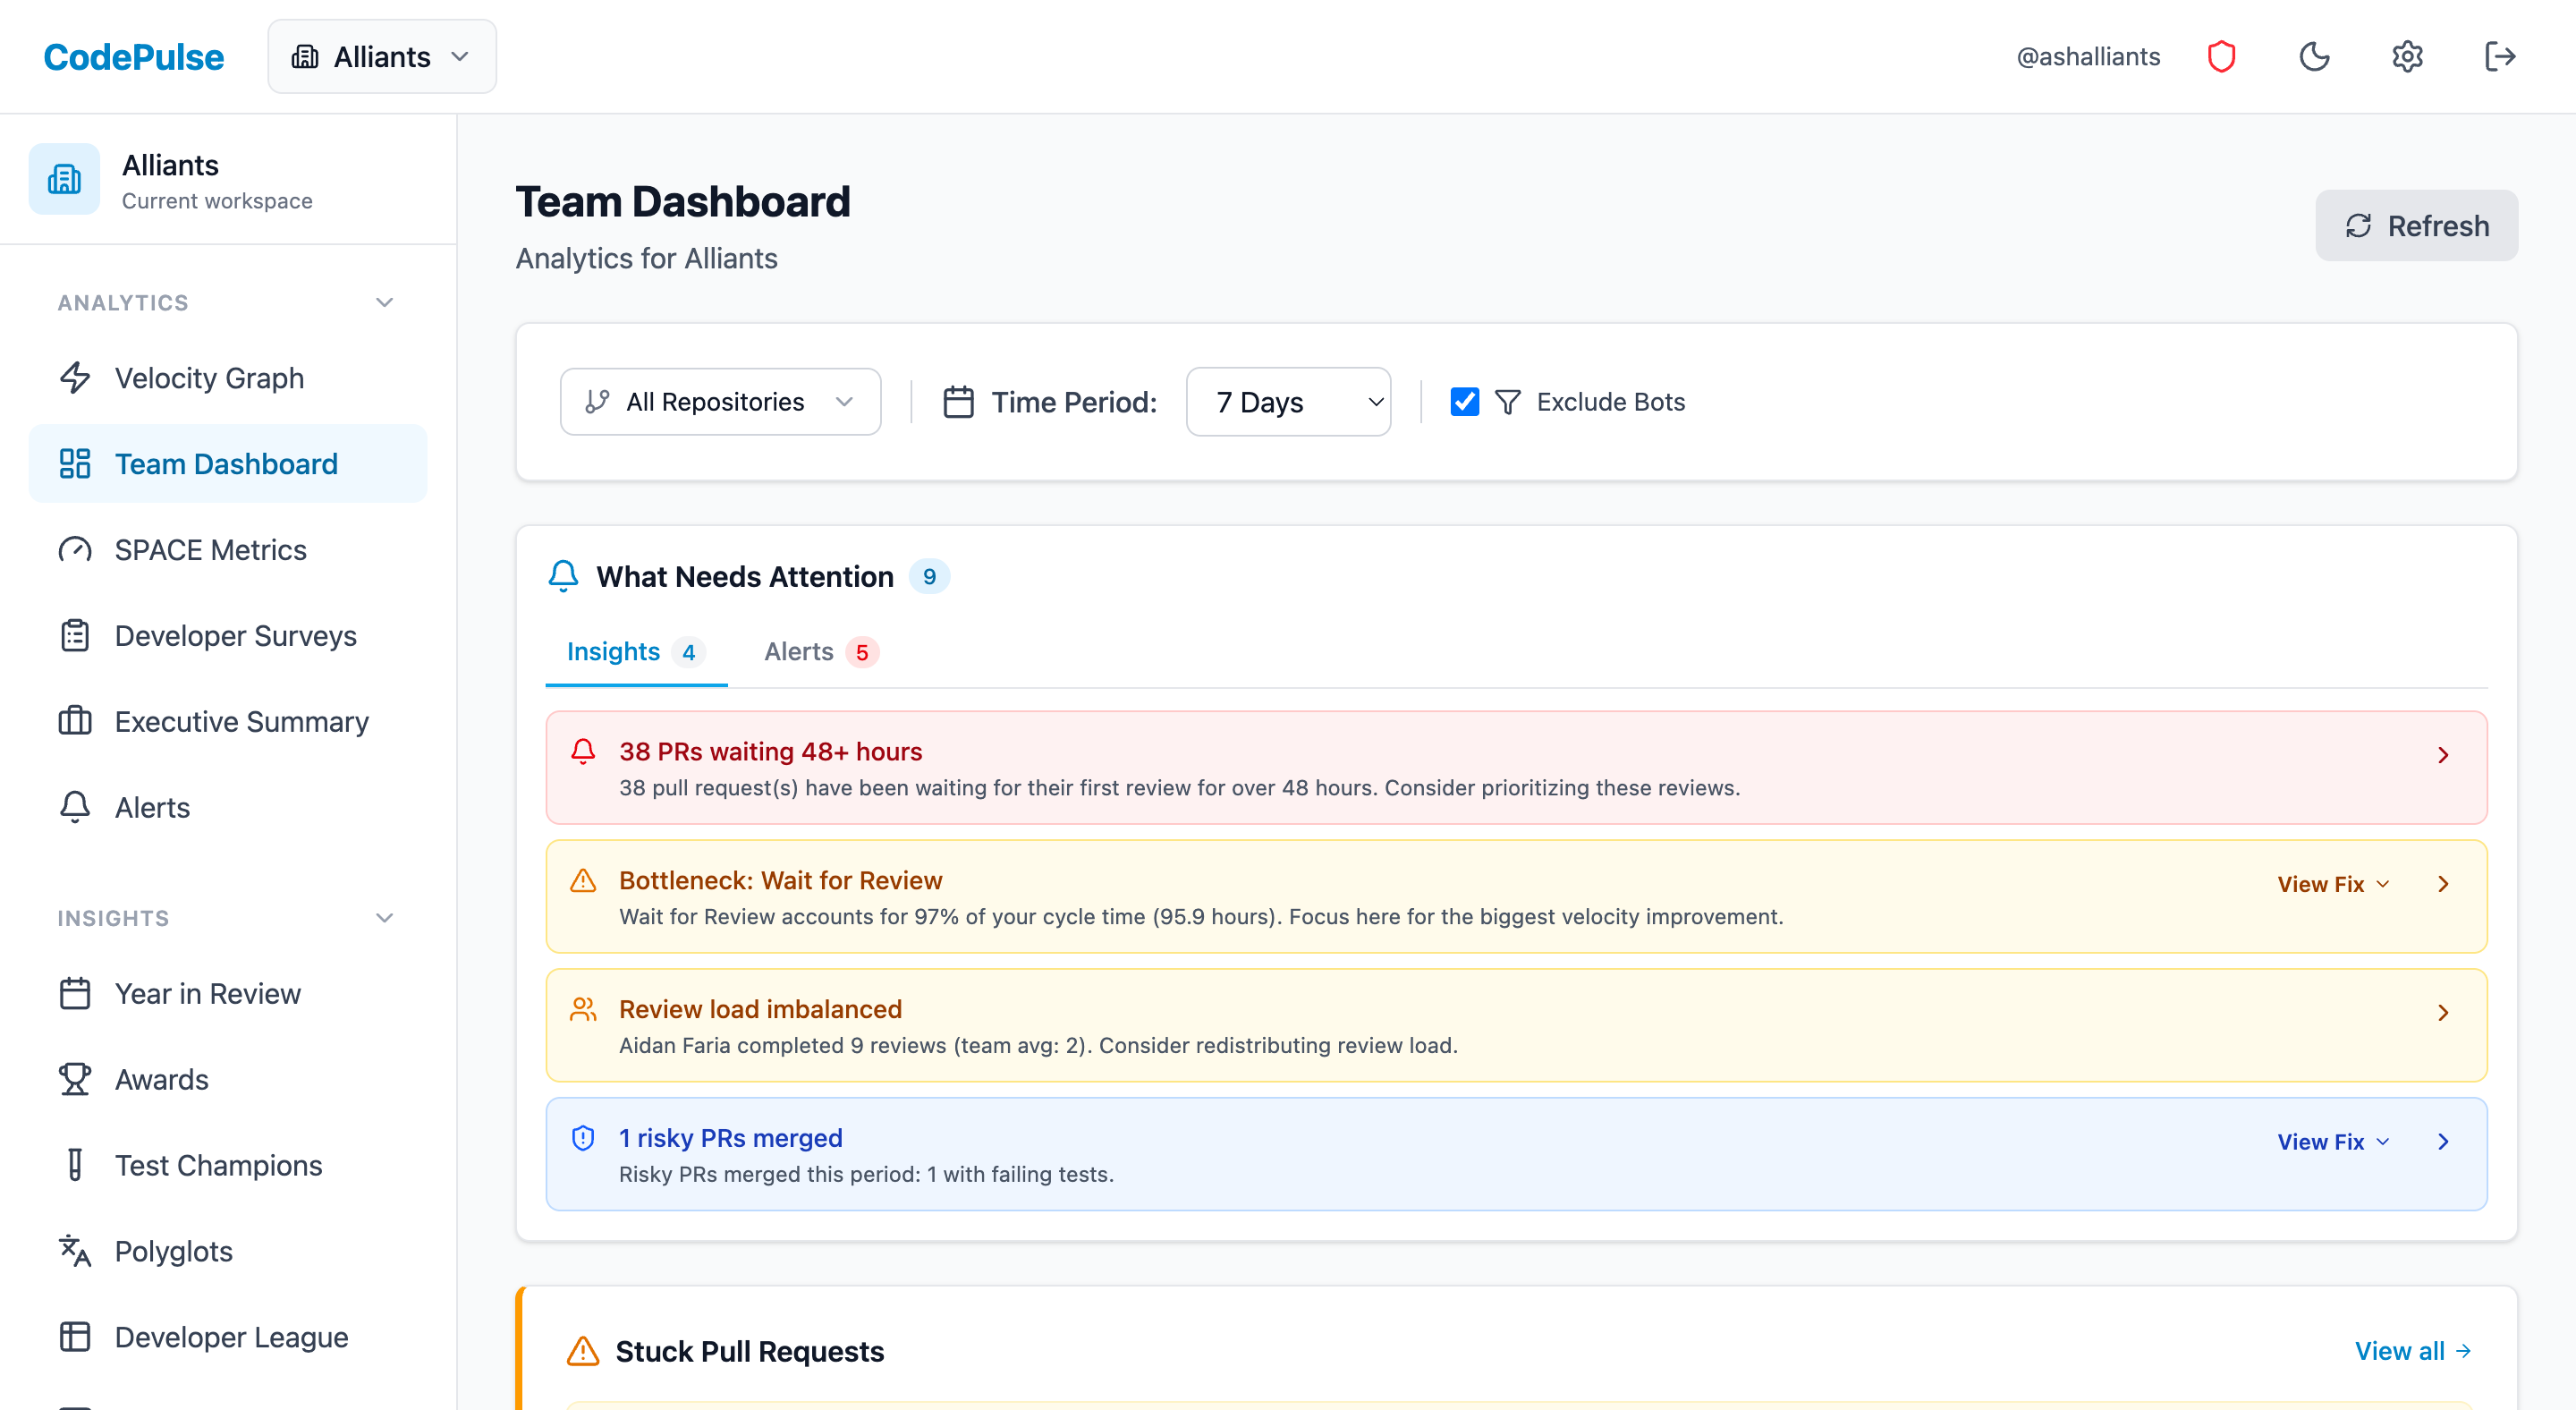
See the report CodePulse produces from read-only GitHub workflow data, or connect your own repositories and evaluate the fit with real evidence.
Read-only GitHub · Your code stays yours · Team-level by default · No credit card
"Engineering management platform" shows up on every major vendor's homepage in this category, but the label covers products with real differences in emphasis - some lean toward workflow automation, some toward finance-facing reporting, some toward developer experience surveys. Understanding what the category actually promises, and where individual products diverge from that promise, matters more than picking whichever one ranks first in a search.
What is an engineering management platform?
An engineering management platform (EMP) is software that gives engineering leadership visibility into software delivery by combining real delivery metrics (cycle time, deployment frequency, review coverage) drawn from systems like GitHub, resource-allocation reporting (where engineering time goes across features, maintenance, and tech debt), and reporting built for non-engineering stakeholders like finance and the board. Jellyfish, LinearB, Swarmia, and CodePulse are all commonly placed in this category, despite meaningfully different feature emphases and pricing models within it.
The category emerged from a specific gap: project management tools like Jira track planned work, but planned work and actual delivery diverge constantly, and until this category existed, engineering leaders had no independent way to see that gap without asking a manager to compile a status report by hand.
An engineering management platform's job is to answer "what actually happened," not "what was supposed to happen" - that second question already has a home in your issue tracker.
What Does an Engineering Management Platform Actually Do?
Three capabilities show up across nearly every product in the category, even as the specific implementation varies. Delivery metrics - cycle time, deployment frequency, review coverage, code churn - computed from real system-of-record data (GitHub PRs and commits, sometimes CI logs) rather than self-reported status updates. Investment or work-type allocation - classifying engineering time across categories like new features, maintenance, technical debt, and infrastructure, usually the single most-requested capability from finance and the board. And executive reporting - a view built for someone who doesn't read Jira tickets for a living, exportable into a board deck without translation.
How Do Vendors in the Category Actually Differ?
Beyond the shared core, products in this category split along a few real axes: scope (GitHub-only versus multi-VCS/multi-issue-tracker), pricing model (per-seat versus flat versus sales-negotiated), and specialization (workflow automation, AI-spend tracking, or developer experience surveys as an additional pillar). Those differences matter more to an actual buying decision than which one has the flashiest homepage.
| Axis | What to check before buying |
|---|---|
| Scope | GitHub-only, or does it also need to cover GitLab, Bitbucket, Azure DevOps? |
| Pricing model | Per seat, flat per org, or sales-negotiated with no published price? |
| Specialization | Workflow automation, AI-spend tracking, or capitalization reporting as an added focus? |
| Setup path | Self-serve trial, or a sales-led evaluation before you see real data? |
* Our Take
The category's biggest reputational risk is being adopted as a surveillance tool rather than a delivery-visibility tool - and the platforms themselves usually aren't the ones who decide which it becomes.
A platform that reports individual output numbers to a manager with no team-level framing gets used as a performance-review weapon regardless of what the vendor intended. The tools that hold up over time default to team-level reporting and treat individual metrics as a debugging tool, not a scorecard - check which posture a vendor takes before rolling anything out broadly.
Where Does CodePulse Fit?
CodePulse is an engineering management platform in the category sense - it reads GitHub history and turns it into delivery metrics, investment allocation, and executive reporting. It's deliberately narrower in scope than some of the larger vendors in this space: GitHub-only rather than multi-VCS, and without gitStream-style PR automation or DevFinOps-grade capitalization compliance reporting. What it adds instead is a flat price per organization and a self-serve trial, rather than a per-seat cost that scales against headcount or a sales-negotiated contract.
* How to See This in CodePulse
Navigate to Executive Summary for the leadership-facing view the category is built around:
- Cycle time, health grade, and investment allocation combined on one exportable page
- Pair it with Investment Allocation for the feature-vs-maintenance-vs-tech-debt breakdown finance usually asks for
- Team-level by default, with individual metrics gated behind an explicit opt-in
The right engineering management platform is the one whose scope matches your actual problem - not the one with the longest feature list.
For a head-to-head against the larger vendors in this category, see our engineering analytics tools comparison, or our best engineering analytics tools roundup for a shorter shortlist.
If you want to see your own delivery metrics and investment breakdown before deciding on a platform, start a free CodePulse trial. It reads directly from your GitHub history, so there's nothing to configure before you see real numbers.
Frequently Asked Questions
An engineering management platform (EMP) is software that gives engineering leaders visibility into how their team delivers software - typically combining delivery metrics (cycle time, deployment frequency), resource allocation (where engineering time goes across features, maintenance, and tech debt), and reporting built for a non-engineering audience like finance or the board. It's a category, not a single product - Jellyfish, LinearB, Swarmia, and CodePulse are all commonly described as engineering management platforms, despite fairly different feature emphases within that label.
Evaluate CodePulse against your own delivery history
A comparison table only goes so far. Connect read-only GitHub in about five minutes and judge the output on your repositories, at one flat price, with no per-seat math.
Read-only GitHub · Your code stays yours · Team-level by default · No credit card
See These Features in Action
Explore all featuresRelated Guides
Jellyfish vs LinearB vs Swarmia: Full 2026 Comparison
Compare Jellyfish, LinearB, Swarmia, Allstacks, Haystack and more engineering analytics tools. Features, pricing, cycle time benchmarks, and integrations.
Best Engineering Analytics Tools for 2026 (Ranked by Real Users)
We ranked the 10 best engineering analytics tools based on metric depth, setup speed, pricing transparency, and privacy posture. Honest pros and cons for each.
Engineering Analytics ROI: The Budget Approval Playbook
Calculate the ROI of engineering analytics tools with formulas for time savings, payback period, and a business case template tailored to CFOs, CTOs, and CEOs.
Engineering Intelligence Platforms: What They Do
Engineering intelligence platforms promise visibility. Most deliver dashboards. What the category means, which tools deliver, and whether you need one.