See these metrics for your own team
CodePulse turns your GitHub history into engineering insights in about 5 minutes. Free to start, no credit card.
Get started freeEfficiency is doing things right. Effectiveness is doing the right things. The distinction sounds academic, but it represents a fundamental shift in how engineering organizations create value. This guide explores why the most impactful teams focus on effectiveness over efficiency, and how to make the transition.
Our Take
You can have a highly efficient team building the wrong thing. They'll ship fast, their cycle times will be excellent, and they'll celebrate their velocity - right up until the product fails. Efficiency without effectiveness is the fastest route to irrelevance. Stop optimizing delivery speed until you've verified you're delivering the right outcomes.
The Critical Distinction
Engineering leaders often use "efficiency" and "effectiveness" interchangeably. This is a category error that leads to misaligned incentives and wasted effort.
Efficiency (Doing Things Right)
- Optimizing process and throughput
- Reducing waste and friction
- Maximizing output per unit of input
- Measured by velocity, cycle time, cost
- Question: "How fast can we ship?"
Effectiveness (Doing the Right Things)
- Aligning work with business outcomes
- Delivering user and market value
- Maximizing impact per unit of effort
- Measured by adoption, revenue, satisfaction
- Question: "Should we ship this at all?"
"According to the SaaS Product Metrics Benchmark Report, the average adoption rate for features is only 24.5%. That means 75% of what engineering ships isn't widely used. Efficiency optimization can't fix a problem that fundamental."
The distinction matters because optimizing for the wrong dimension wastes resources. A team that ships 50% faster but builds features no one uses hasn't improved outcomes - they've just accelerated waste.
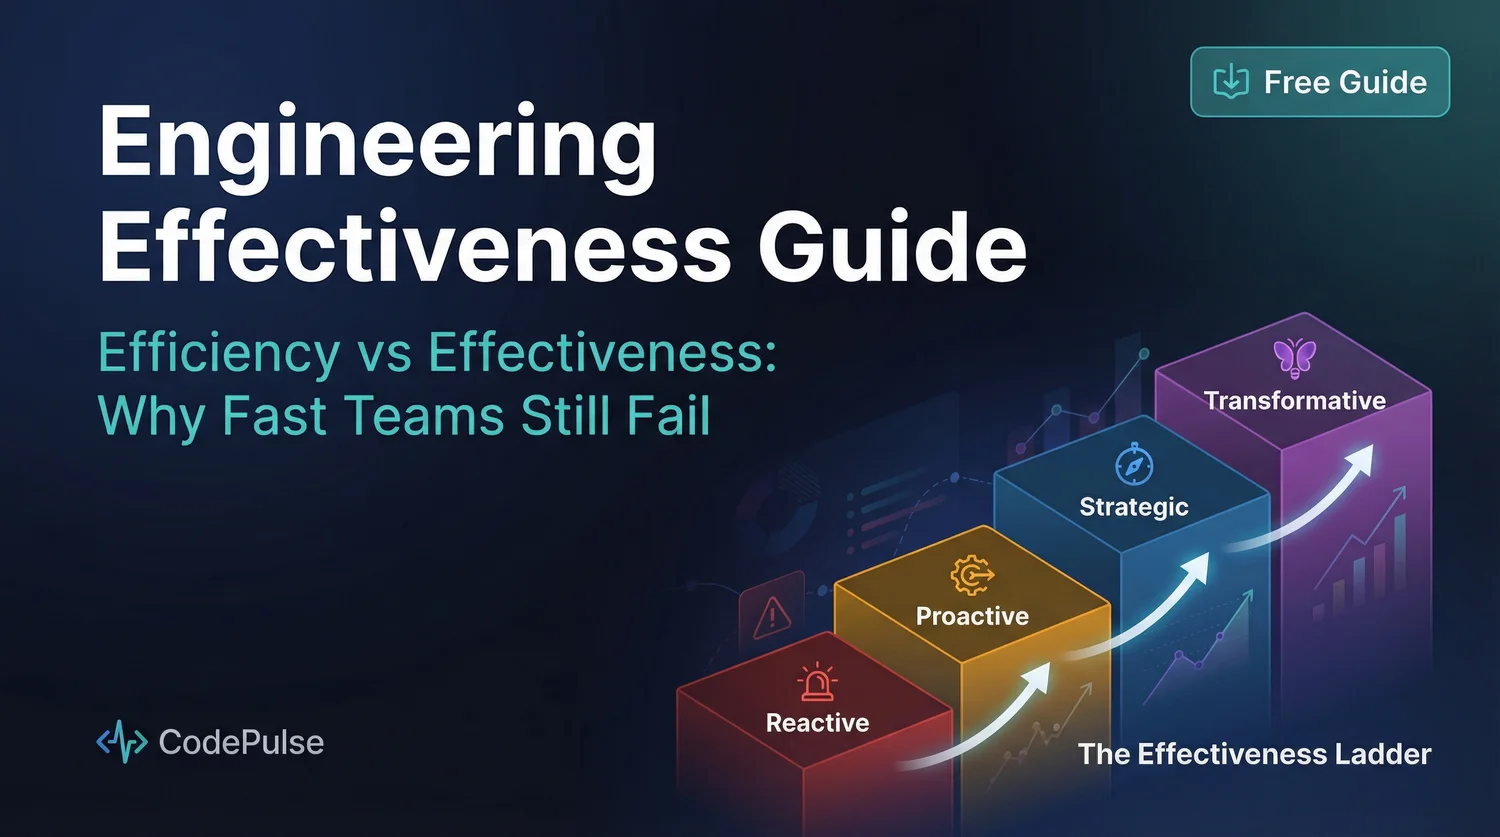
The Effectiveness Ladder Framework
Engineering teams don't jump from firefighting to strategic impact overnight. They climb a ladder, with each rung representing a more sophisticated relationship with value creation. Most teams are stuck on the first two rungs, optimizing activity rather than impact.

Level 1: Reactive
At this level, engineering operates in permanent fire-fighting mode. Success is measured by whether things shipped, regardless of what was shipped or why. Teams celebrate "busy" and conflate activity with progress.
Characteristics of Reactive Teams
- Metrics focus: Lines of code, commits, story points
- Planning horizon: Sprint-to-sprint
- Primary question: "Did we ship?"
- Failure mode: Shipping fast without direction
- Leadership signal: Celebrating velocity regardless of outcome
Level 2: Proactive
Teams at this level have moved beyond pure activity tracking to process optimization. They understand flow, identify bottlenecks, and systematically remove friction. This is where most "mature" engineering organizations plateau.
Characteristics of Proactive Teams
- Metrics focus: Cycle time, deployment frequency, DORA metrics
- Planning horizon: Quarter-by-quarter
- Primary question: "Did we ship efficiently?"
- Failure mode: Optimizing speed of wrong deliverables
- Leadership signal: Celebrating process improvements
The trap at Level 2 is believing that efficiency optimization is the end goal. Teams can achieve elite DORA metrics while building products that fail in the market. Process excellence is necessary but not sufficient.
"Velocity means little without alignment, and shipping fast doesn't help if the wrong things are going out the door. In a time when expectations have shifted from 'grow at all costs' to efficient growth, output still matters - but not without context."
Level 3: Strategic
Strategic teams connect engineering output to business outcomes. They don't just ask "can we build this?" but "should we build this?" and "what happens when we do?" This requires tight collaboration with product and business stakeholders.
Characteristics of Strategic Teams
- Metrics focus: Feature adoption, time to value, business outcomes
- Planning horizon: Roadmap alignment (6-12 months)
- Primary question: "Did we ship the right thing?"
- Failure mode: Analysis paralysis, over-planning
- Leadership signal: Celebrating user outcomes, not just releases
The shift from Level 2 to Level 3 requires changing what you celebrate. Instead of praising fast cycle times, praise features that moved the needle on user behavior or business metrics. This signals to the team that outcome matters more than output.
Level 4: Transformative
The highest level of effectiveness isn't just delivering what the market expects but shaping what the market wants. Transformative teams anticipate needs, take calculated risks, and create new categories. Few organizations consistently operate here.
Characteristics of Transformative Teams
- Metrics focus: Market impact, category leadership, innovation rate
- Planning horizon: Strategic bets (1-3 years)
- Primary question: "Did we change the game?"
- Failure mode: Over-investment in speculative projects
- Leadership signal: Celebrating calculated risks and learnings
Track Your Climb Up the Ladder
CodePulse helps teams move beyond activity metrics to outcome-focused measurement. See where your engineering time goes, identify waste, and connect delivery to business results.
Measuring Effectiveness (Not Just Efficiency)
Most engineering metrics measure efficiency: how fast you ship, how often you deploy, how quickly you respond to incidents. Effectiveness metrics are harder to capture but more important. Here's a framework for balanced measurement.
The Effectiveness Metrics Stack
| Metric Type | What It Measures | Example Metrics |
|---|---|---|
| Activity | What the team is doing | PRs merged, commits, deployments |
| Flow | How smoothly work moves | Cycle time, lead time, WIP |
| Quality | Whether the work is sound | Change failure rate, bug escape rate |
| Adoption | Whether users care | Feature adoption, engagement, retention |
| Impact | Whether business outcomes improve | Revenue impact, cost savings, NPS |
The mistake most organizations make is measuring only the top two rows (Activity and Flow) and assuming the rest will follow. But a team can have excellent activity metrics - high PR throughput, fast cycle times - while shipping features that no one uses and that don't move business outcomes.
Our Take
If your dashboards only show engineering activity and flow metrics, you're flying blind on effectiveness. At minimum, pair every velocity metric with an adoption metric. Fast cycle time means nothing if feature adoption is 24%.
Making the Shift: Practical Steps
Moving up the effectiveness ladder isn't a one-time transformation. It's a deliberate practice that requires changes to what you measure, how you plan, and what you celebrate.
Step 1: Audit Your Current Metrics
List every metric your engineering organization tracks and categorize them:
- Activity metrics (PRs, commits, deployments) - necessary but insufficient
- Flow metrics (cycle time, lead time) - efficiency indicators
- Outcome metrics (adoption, revenue impact) - effectiveness indicators
If more than 80% of your metrics fall into the first two categories, you're measuring efficiency, not effectiveness. The goal is a balanced portfolio with meaningful representation in all three.
Step 2: Connect Engineering to Outcomes
For every major initiative, define the expected outcome before development starts. This isn't just acceptance criteria - it's the business result you expect the feature to produce.
Example: New Checkout Flow Feature

❌ Efficiency framing:
   "Ship by Q2. Target cycle time: 5 days per PR."

✅ Effectiveness framing:
   "Reduce cart abandonment by 15% within 60 days of launch."

The first tells you how fast to go.
The second tells you if the destination was worth reaching.
Step 3: Pair Metrics in Tension
Single metrics get gamed. Paired metrics reveal trade-offs. Every efficiency metric should have a corresponding quality or outcome metric that ensures speed doesn't come at the expense of effectiveness.
| Efficiency Metric | Paired With | Why It Matters |
|---|---|---|
| Deployment Frequency | Change Failure Rate | Fast deploys that break things aren't progress |
| Cycle Time | Feature Adoption Rate | Fast delivery of unused features is waste |
| PR Throughput | Review Quality Score | Rubber-stamped reviews defeat the purpose |
| Velocity (Story Points) | Business Outcome Achievement | Points don't matter if goals aren't met |
"Driving one number in isolation creates distortion. If you chase deployment frequency without watching failure rates, you may reduce stability while trying to look fast. Metrics should be paired in tension to show the trade-offs."
Step 4: Change What You Celebrate
Culture follows what leaders pay attention to. If you want effectiveness, you need to celebrate effectiveness. This means shifting recognition from activity to impact.
❌ Stop Celebrating
- "We shipped 47 PRs this sprint!"
- "Our velocity increased 30%!"
- "We hit 100% sprint completion!"
- "The team worked all weekend to ship!"
✅ Start Celebrating
- "Feature X drove 20% conversion increase!"
- "We reduced churn by 15% with this fix!"
- "Our NPS improved after the redesign!"
- "We killed a project that wasn't working!"
Anti-Patterns: What Undermines Effectiveness
Several common practices actively undermine engineering effectiveness. Recognizing them is the first step to eliminating them.
Anti-Pattern 1: The Feature Factory
Feature factories treat engineering as a ticket-processing machine. Success is measured by how many features ship, with little attention to whether those features create value.
Signs: Roadmaps measured in features, not outcomes. No post-launch validation. No mechanism to kill underperforming features.
Fix: Attach outcome hypotheses to every initiative. Measure post-launch. Sunset features that don't perform.
Anti-Pattern 2: Velocity as a Goal
When velocity becomes a target, teams game it. Story points inflate, work fragments into smaller tickets to show "more done," and the metric becomes meaningless.
Signs: Velocity targets in performance reviews. Point inflation over time. Managers asking "why is velocity down?" without context.
Fix: Treat velocity as a planning tool, not a performance indicator. Focus on outcome delivery instead.
Anti-Pattern 3: Efficiency Theater
Some organizations optimize their metrics dashboards instead of their outcomes. They achieve "elite" DORA metrics through superficial changes that don't translate to better products.
Signs: Micro-PRs to game cycle time. Deployments without customer impact. Incident tracking that makes MTTR look good.
Fix: Pair efficiency metrics with effectiveness metrics. Require customer impact evidence.
Aligning with Existing Frameworks
The effectiveness lens integrates with popular engineering frameworks rather than replacing them.
DORA Metrics
DORA metrics (deployment frequency, lead time, change failure rate, MTTR) measure efficiency - how well your delivery pipeline works. They don't measure whether what you're delivering matters. Use DORA as your efficiency baseline, then add effectiveness metrics on top.
Learn more about implementing DORA metrics →
SPACE Framework
The SPACE framework (Satisfaction, Performance, Activity, Communication, Efficiency) comes closer to effectiveness by including Satisfaction and Performance dimensions. However, most implementations still focus heavily on Activity and Efficiency.
To use SPACE effectively, emphasize the "P" (Performance, meaning quality and impact of work) and "S" (Satisfaction, indicating sustainable practices) dimensions as much as the efficiency dimensions.
Google's Project Aristotle Findings
Google's research on effective teams found that psychological safety, dependability, structure, meaning, and impact were the key factors. Notice that "efficiency" didn't make the list - effectiveness depends more on team dynamics than process optimization.
Measure What Matters
CodePulse provides both efficiency and effectiveness insights. Track cycle time alongside collaboration patterns, review quality, and team health indicators that correlate with real outcomes.
Building an Effectiveness-First Culture
Shifting from efficiency to effectiveness requires cultural change, not just new metrics. Here's how to build the habits that support effective engineering.
Include Engineers in Goal Setting
When engineers understand why something matters, they make better decisions about how to build it. Include them in outcome discussions, not just task assignments.
"Include developers in metric selection to build ownership and understanding of measurement goals. Focus on results and team effectiveness, not individual presence or activity."
Practice Outcome-Based Retrospectives
Instead of asking "what did we ship?" in retrospectives, ask:
- What outcomes did our work drive?
- What did we ship that no one used? Why?
- What should we have killed sooner?
- What did we learn about our users?
Reward Saying No
Effective teams say no to work that won't drive outcomes. This requires psychological safety and explicit permission. Celebrate the engineer who pushes back on a feature request with a better alternative.
Conclusion: Effectiveness is a Competitive Advantage
In an era of efficiency pressure, the teams that win aren't the ones that ship fastest - they're the ones that ship the right things. Efficiency can be optimized, copied, and eventually automated. Effectiveness - knowing what to build and why - remains a human competitive advantage.
Start by auditing your current metrics. Count how many measure activity versus outcomes. Then begin pairing efficiency metrics with effectiveness metrics. Change what you celebrate. Over time, you'll climb the ladder from reactive to transformative.
The goal isn't to abandon efficiency - it's to ensure efficiency serves effectiveness. A highly efficient team building the right things is unstoppable. A highly efficient team building the wrong things is just fast at failing.
Final Take
Stop asking "how fast can we ship?" Start asking "what happens when we do?" The first question optimizes the machine. The second ensures the machine is pointed in the right direction. You need both, but sequence matters - effectiveness first, efficiency second.
Related Resources
- Engineering Headcount Planning
- The Complete Guide to Engineering Metrics
- Software Engineering KPIs: What to Measure and Why
- VP Engineering Metrics: What Belongs on Your Dashboard
- Developer Velocity: Beyond the Buzzword
Ready to Measure Effectiveness?
CodePulse connects your engineering activity to outcomes. See which work drives value and which creates waste.
Free tier available. No credit card required.
See these insights for your team
CodePulse connects to your GitHub and shows you actionable engineering metrics in minutes. No complex setup required.
Free tier available. No credit card required.
See These Features in Action
Board-ready engineering performance in a single page.
Break down cycle time into coding, waiting, review, and merge phases.
Related Guides
The Complete Guide to Engineering Metrics in 2026
Engineering metrics are everywhere, but most teams measure the wrong things. This guide covers what to measure, what to ignore, and how to build a metrics program that drives decisions - not just reports.
Software Engineering KPIs: 15 That Actually Work
Most teams confuse metrics with KPIs. This guide explains the KPI Pyramid framework - leading indicators, lagging indicators, and business outcomes - plus the anti-patterns that destroy team effectiveness.
VP Engineering Board Metrics: 7 Numbers That Defend Headcount
The 7 metrics VPs of Engineering need for board presentations: delivery predictability, investment allocation, and team health - with the language to present them.
Story Points Are Dead. What Elite Teams Measure
Move beyond story points. Learn modern velocity metrics that measure real delivery speed, how to improve velocity sustainably, and avoid common pitfalls.