
See exactly where your delivery flow is waiting
Preview the phase-by-phase report for review pickup, active review, and merge time. Connect in about five minutes; the initial analysis runs after sync.
Read-only GitHub · Your code stays yours · Team-level by default · No credit card
Two teams both say they ship "in about a week," yet one keeps missing its commitments. The gap usually comes down to which clock each team is watching. Cycle time and lead time sound interchangeable, but they measure different windows of your delivery pipeline, and mixing them up hides the bottleneck that's actually costing you.
What's the difference between cycle time and lead time?
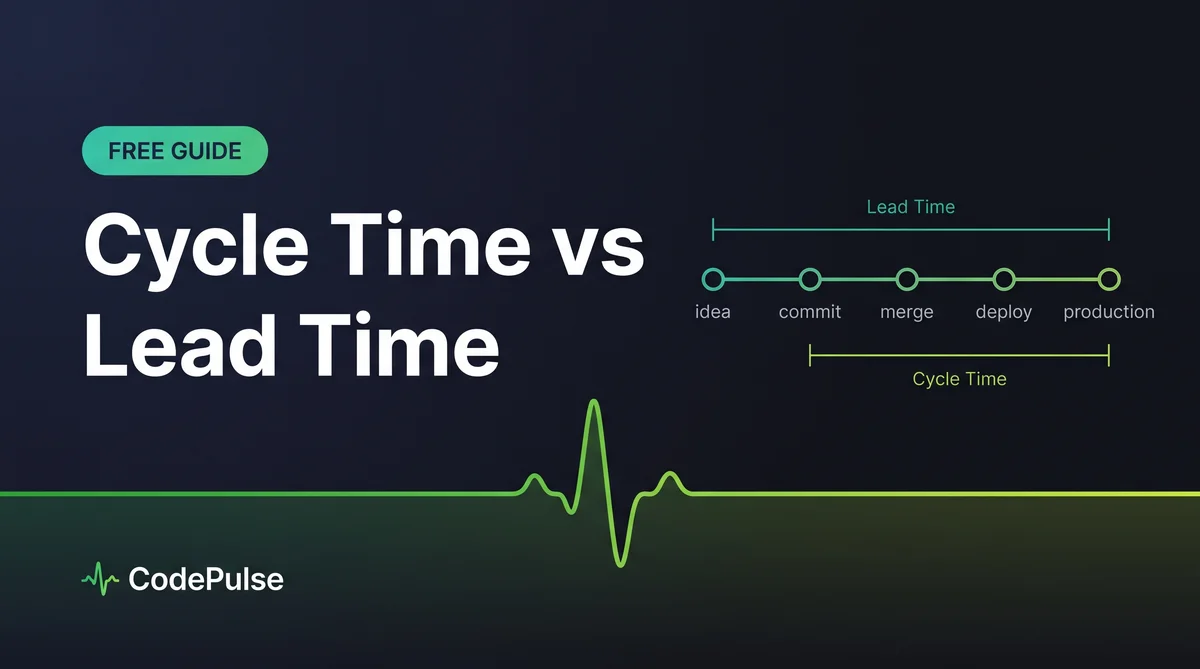
Lead time measures the full journey from when work is requested to when it's delivered to the customer, including all waiting and queue time. Cycle time measures only the active work window, from when the team starts an item to when it's finished. Cycle time sits inside lead time as a subset. In software, DORA's metric 'lead time for changes' is a narrower, engineering-owned version: the time from a commit landing in version control to that change running in production.
Both terms come from Lean manufacturing, where lead time meant the span between a customer placing an order and receiving the product, and cycle time meant how long a single unit took to move through the line once work began. Software teams borrowed both, but the definitions drifted, and vendors now use the same words for different windows. This guide pins down each term, shows how they overlap, and helps you decide which one to put on your dashboard.
What Is Cycle Time?
Cycle time measures the active work window: the elapsed time from when your team starts an item to when that item is done. In software, "started" usually means the first commit on a branch, and "done" means the change is merged or deployed. It excludes the time a request spent sitting in a backlog before anyone picked it up.
Cycle time is internally focused. It reflects how efficiently your engineering workflow moves a change from keyboard to production, and it's the number your team has the most direct control over. That's why it's the go-to metric for spotting where work stalls inside the delivery pipeline.
Most teams break cycle time into four phases so they can see exactly where time goes:
- Coding time: first commit to the moment a pull request opens.
- Pickup time: PR opens to the first review starting (pure waiting).
- Review time: first review to the PR being approved and merged.
- Deploy time: merge to the change running in production.
Splitting the number this way turns a vague "our PRs are slow" complaint into a specific target. Our cycle time breakdown guide walks through diagnosing each phase, and if you want to reduce the total, the PR cycle time playbook covers the fixes that help most.
"Cycle time answers a question your team can act on this week: once we start, how long does it take us to finish?"
What Is Lead Time?
Lead time measures the entire journey from the moment work is requested to the moment it's delivered. It starts when a customer, product manager, or stakeholder asks for something, and it ends when that something is in their hands. It also includes every wait: time in the backlog, time blocked on dependencies, and time in review.
Because it counts all that queue time, lead time reflects the customer's experience. It's the honest answer to "when will I get this?" And it isn't owned by engineering alone. Product prioritization, stakeholder decisions, and backlog grooming all shape lead time long before an engineer writes a single line of code.
That shared ownership is what makes lead time so useful for planning conversations and so misleading as an engineering scorecard. A rising lead time might mean your pipeline slowed down, or it might just mean requests are piling up faster than the team can start them. The number alone doesn't tell you which.
What Is the Difference Between Cycle Time and Lead Time?
The core difference is where each clock starts. Lead time starts at the request; cycle time starts when work actually begins. Everything before the first commit, the backlog wait, the prioritization debate, the "we'll get to it next sprint," counts against lead time but not against cycle time. That makes cycle time a subset of lead time: the active portion carved out of the whole.
Here's how the two compare side by side:
| Aspect | Cycle Time | Lead Time |
|---|---|---|
| What it measures | The active work window for a change | The full request-to-delivery journey |
| Where it starts | When work begins (first commit) | When the request is made |
| Where it ends | When the change is merged or deployed | When the customer receives the change |
| Includes backlog and queue wait? | No | Yes |
| Whose perspective | The engineering team | The customer or stakeholder |
| Who influences it | Mostly engineering workflow | Engineering plus product and prioritization |
| How to improve it | Smaller PRs, faster reviews, quicker deploys | Better prioritization, less queueing, plus every cycle-time fix |
A useful mental shortcut: cycle time is about how fast your team executes, and lead time is about how fast you meet demand. Improving cycle time will pull lead time down, but you can also shrink lead time by fixing prioritization and cutting wait time before work starts. That's the diagnostic power of holding both numbers next to each other.
🔥 Our Take
Most teams argue about which metric is "correct" when they should be running both. Cycle time is your engineering thermometer, and lead time is what your customers and executives actually feel. Pick one and you'll improve the wrong half of the system.
And neither number is a stick to beat individuals with. These are system metrics. If a team's cycle time is climbing, the honest response is to ask what's slowing the pipeline, oversized PRs, a review queue with one overloaded person, a flaky deploy, not to rank developers by who merges fastest. Speed you extract by pressure is speed you pay back in defects.
Where Does DORA's Lead Time for Changes Fit?
DORA's "lead time for changes" is the source of most of the confusion, so it's worth being precise. The DORA research program defines it as "the amount of time it takes for a change to go from committed to version control to deployed in production". Read that carefully: it starts at the commit, not at the request. So despite the name "lead time," DORA's metric is really measuring what most engineering teams call cycle time.
This is why so many tools treat "cycle time" and "DORA lead time for changes" as the same thing. They both cover the engineering-owned window from first commit to production. The broader business lead time, which starts when someone first asks for the work, is a different and larger number.
DORA's research groups teams into performance tiers based on this metric alongside deployment frequency, change fail rate, and failed-deployment recovery time. The point of measuring it isn't to chase a leaderboard spot; it's to see whether your delivery flow is healthy and improving over time. Our DORA metrics guide covers the full four-key set, and the deployment frequency and lead time guide shows how to reconstruct change lead time from GitHub data alone.
"When DORA says 'lead time,' it means commit to production. When Lean says 'lead time,' it means request to delivery. Same words, different clocks, and knowing which one your tool reports saves a lot of pointless debate."
How Do You Measure Each One?
You measure cycle time by timestamping the engineering workflow. For each change, record the first commit, the PR open, the first review, the merge, and the deploy, then subtract to get the total and each phase. GitHub exposes these timestamps through its API, but it doesn't calculate cycle time or its phases for you, so teams either script it or use a platform that reconstructs the phases automatically.
Lead time needs one earlier data point that GitHub can't give you: when the work was requested. That usually lives in your issue tracker as the moment a ticket was created or moved into a "ready" state. Measuring lead time properly means joining issue-tracker data (Jira, Linear, GitHub Issues) to your commit and deploy data so the clock starts at the request, not the first commit.
A practical tip: use the median, not the average. A handful of PRs that sit open for weeks will drag the mean up and make a healthy pipeline look broken. The median tells you what a typical change experiences, and tracking the median over time is a far better signal of whether things are getting better or worse.
💡Cycle Time, Broken Down Automatically
CodePulse reconstructs cycle time and its four phases straight from your GitHub history, no manual timestamping, so you can see whether coding, review wait, review, or deploy is the real bottleneck. Explore the cycle time feature to see the phase breakdown in action.
Which Should Your Team Track?
Track both, but start acting on cycle time because it's the part you control directly. Cycle time surfaces the bottlenecks you can fix inside a sprint, and improving it feeds straight into lead time. Lead time is the number to bring to planning and stakeholder conversations, because it captures the full experience your customers actually have.
The real value shows up when you read the two together. Here's how the combinations diagnose different problems:
- Low cycle time, low lead time: a healthy flow. Work gets picked up quickly and moves through the pipeline fast.
- Low cycle time, high lead time: your pipeline is fine, but requests wait too long before anyone starts them. The fix is prioritization and capacity, not code review.
- High cycle time, high lead time: the delivery pipeline itself is the bottleneck. Break cycle time into phases and find where changes stall.
That second row is the one teams miss most often. When engineering is measured only on lead time, a backlog problem looks like an engineering problem, and the team ends up working harder on something that was never slow. Measuring cycle time separately protects your engineers from taking the blame for upstream queueing. It also keeps the conversation developmental instead of turning delivery metrics into an individual scorecard.
If you want reference points for what "good" looks like, our PR cycle time benchmarks break down realistic ranges by phase so you can calibrate expectations against your own context rather than a vanity target.
How Do You Improve Cycle Time and Lead Time?
Because cycle time is a subset of lead time, every cycle-time improvement helps both numbers. Start there. The highest-impact moves are usually about size and waiting rather than raw coding speed:
- Shrink pull request size. Smaller PRs get reviewed faster, merge cleaner, and carry less risk. This is consistently the single biggest lever on cycle time.
- Cut pickup time. The wait between "PR opened" and "review started" is often the largest phase and it's pure idle time. A review SLA plus alerts when a PR goes stale attacks it directly.
- Reduce deploy friction. If merged code sits for days before it reaches production, more frequent, smaller releases will pull cycle time down.
Lead time needs those fixes plus one more category the engineering pipeline can't touch: the wait before work starts. To bring lead time down beyond what cycle time alone achieves, work on prioritization, keep work-in-progress limits sensible so items don't stall in the backlog, and clear blockers before they queue up. That's where product and engineering share the work.
Whatever you improve, verify it with the numbers rather than gut feel. Change one thing, watch the median cycle time and lead time for a few weeks, and keep what moves the trend. The teams that sustain improvement treat these metrics as a feedback loop, not a target to hit once and forget.
Frequently Asked Questions
No. Lead time measures the whole journey from when work is requested to when it reaches the customer, including every wait and handoff. Cycle time measures only the active work window, from when the team starts an item to when it's done. Cycle time is a subset of lead time, so cycle time is always shorter than or equal to lead time for the same piece of work.
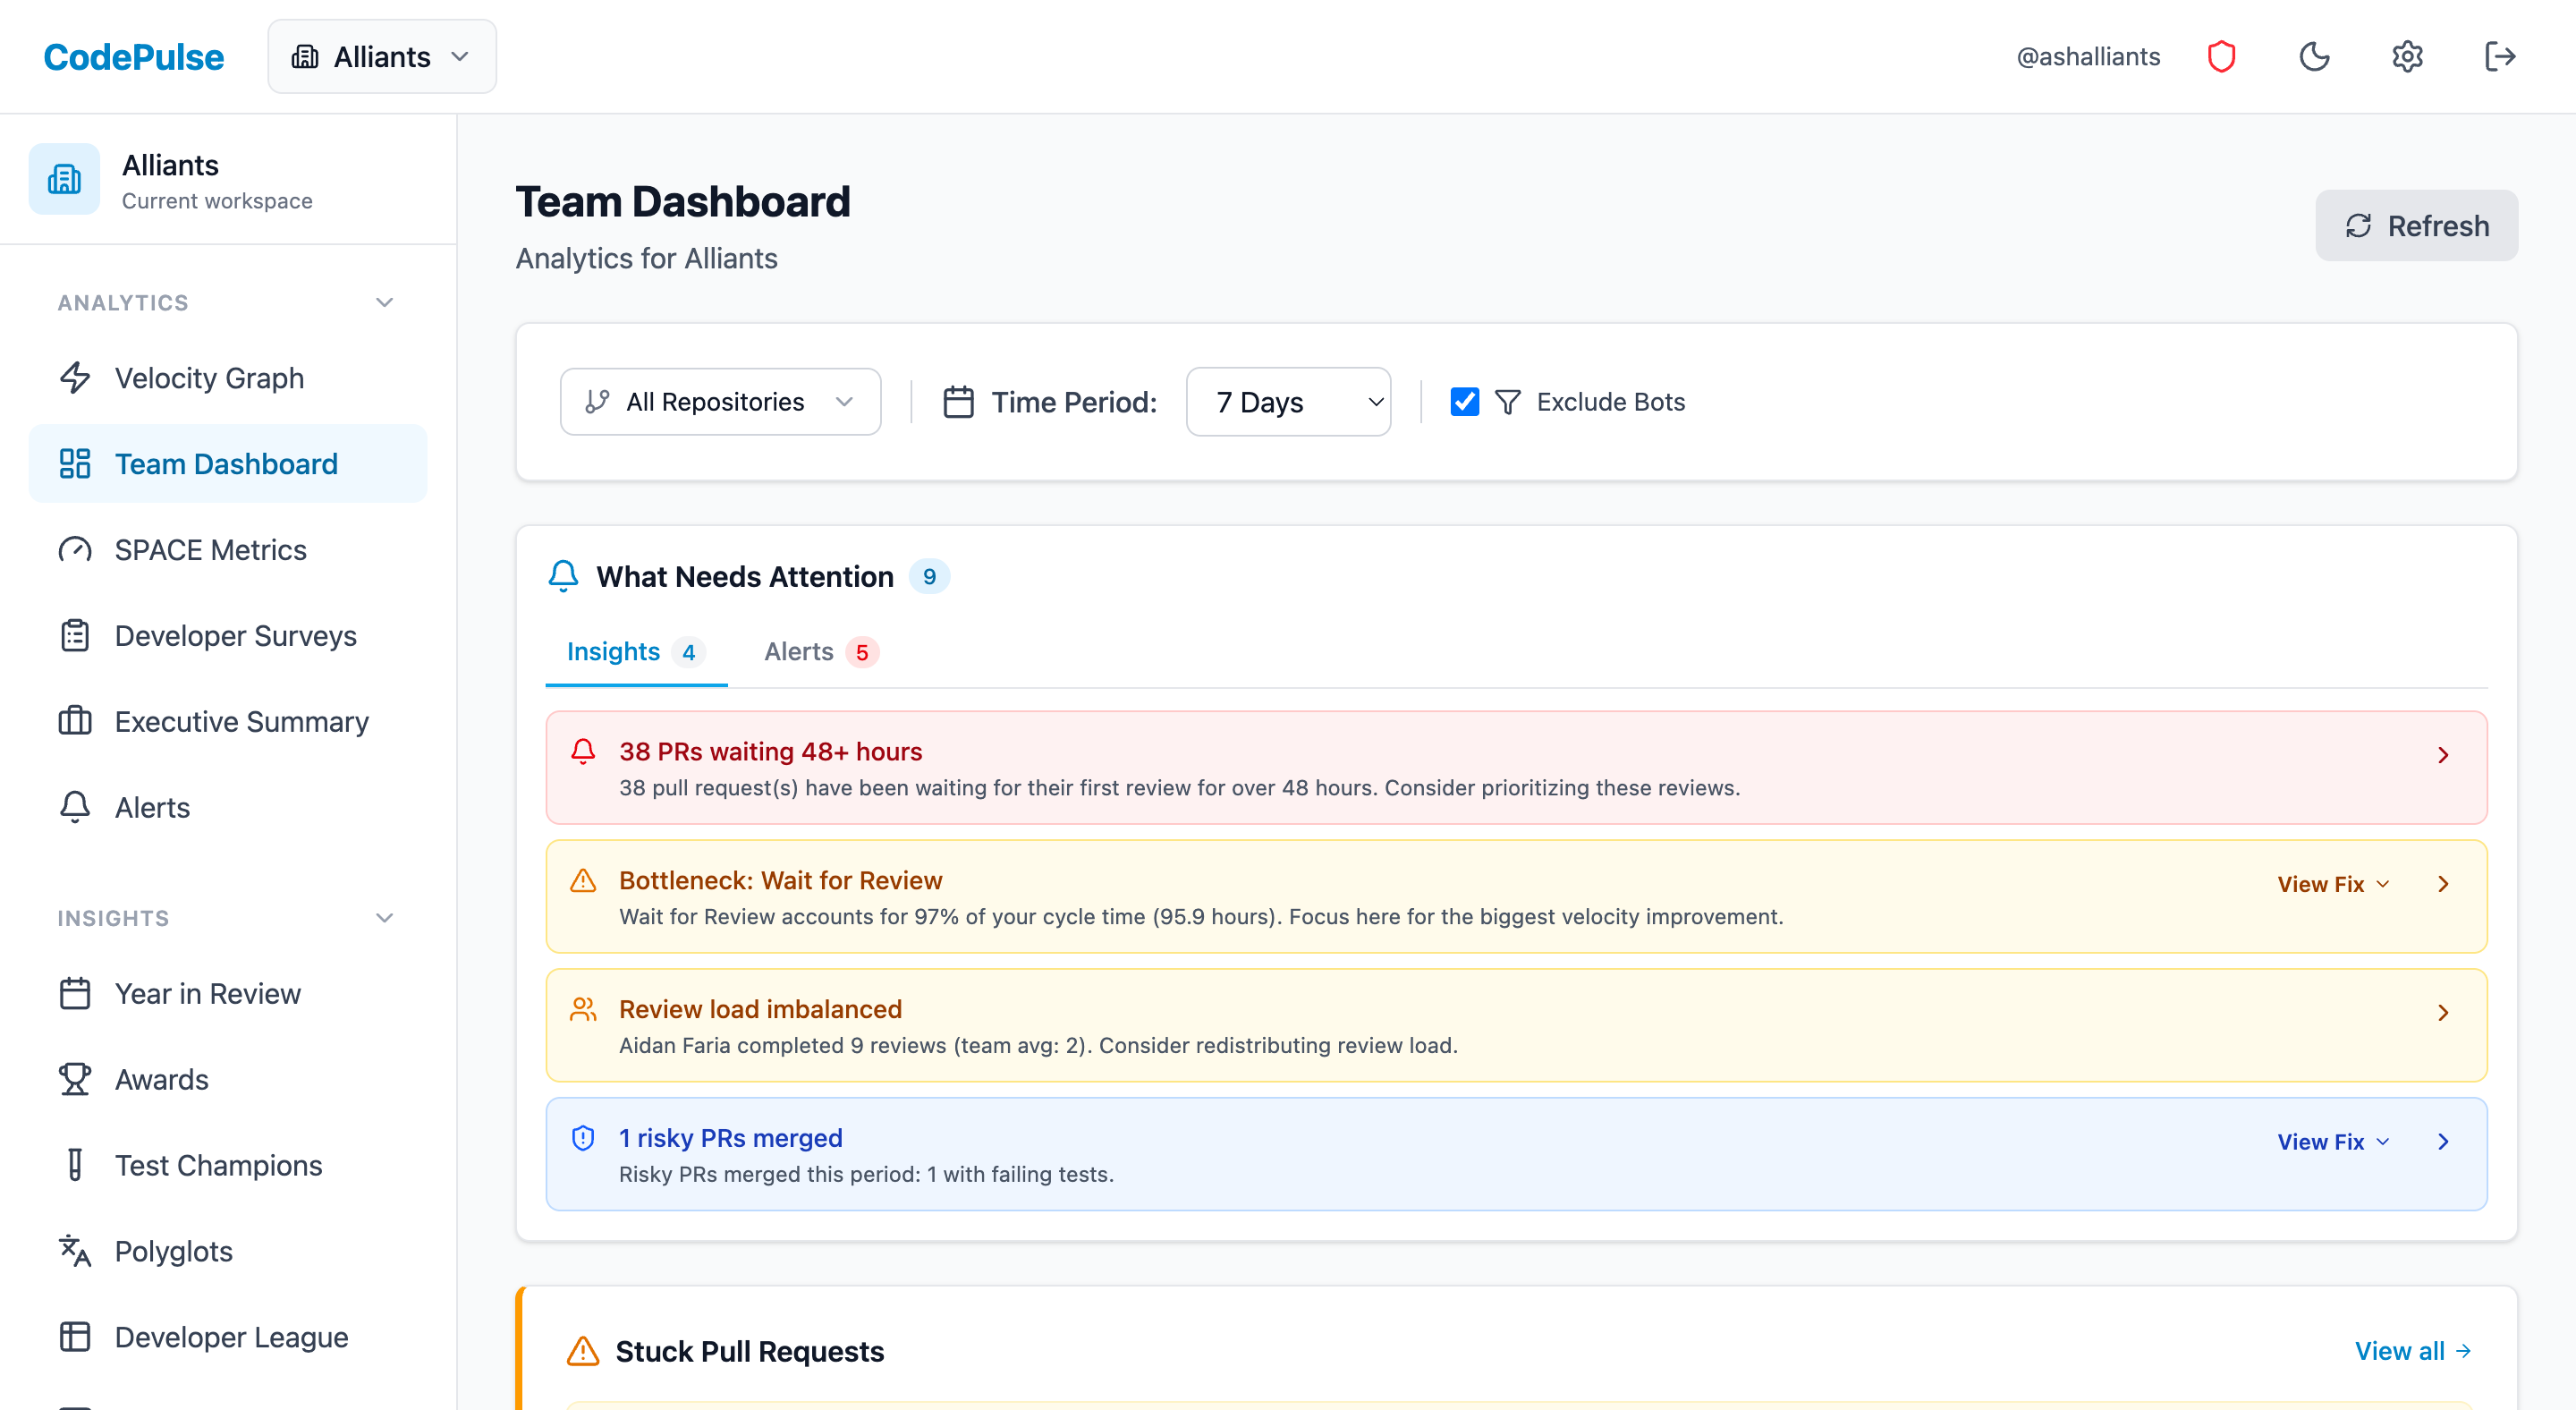
Find out which phase is holding your delivery up
CodePulse splits your cycle time into coding, waiting for review, active review, and merge, so you fix the queue that is actually costing you days. Read-only GitHub, no credit card.
Read-only GitHub · Your code stays yours · Team-level by default · No credit card
See These Features in Action
Break down cycle time into coding, waiting, review, and merge phases.
Track all four DORA metrics and benchmark against industry standards.
Related Guides
The 4-Minute Diagnosis That Reveals Why Your PRs Are Stuck
Learn to diagnose exactly where your PRs are getting stuck by understanding the 4 components of cycle time and how to improve each one.
We Cut PR Cycle Time by 47%. Here's the Exact Playbook
A practical playbook for engineering managers to identify bottlenecks, improve review processes, and ship code faster - without sacrificing review quality.
DORA Metrics Explained: The 4 Keys Without the Hype
A complete breakdown of the four DORA metrics - deployment frequency, lead time, change failure rate, and MTTR - with honest benchmarks and gaming traps to avoid.
Measure Deploy Frequency Without CI/CD (The Hack)
Master DORA deployment frequency and lead time using GitHub data alone, without requiring CI/CD pipeline access.
Your PR Cycle Time Is Fine (Here's the Benchmark)
What is a good PR cycle time? Benchmarks and targets based on team size, industry, and engineering maturity.