See these metrics for your own team
CodePulse turns your GitHub history into engineering insights in about 5 minutes. Free to start, no credit card.
Get started freeEvery engineering leader has metrics. Dashboards full of them. But most can't answer a simple question: "Are we getting better?" The problem isn't a lack of data - it's confusing metrics with KPIs. This guide explains the difference, introduces the KPI Pyramid framework, and gives you a practical set of KPIs that actually drive improvement.
What are the most important software engineering KPIs?
The best engineering KPIs measure outcomes, not activity. Start with Cycle Time (how fast you deliver), Change Failure Rate (how reliably you ship), and Delivery Predictability (how consistently you meet commitments). These three KPIs resist gaming because improving them requires genuine process improvement, not just working harder. CodePulse tracks all three automatically from your Git data.
"A metric becomes a KPI when it directly reflects progress toward a business goal. Everything else is just activity tracking."
What Distinguishes KPIs from Metrics?
According to Jellyfish's analysis, all KPIs are metrics, but not all metrics are KPIs. A metric becomes a KPI when it directly reflects progress toward a business or team goal. This distinction matters because optimizing the wrong thing wastes effort and creates perverse incentives.
| Metric | KPI |
|---|---|
| Lines of code written | Features shipped per quarter |
| Number of commits | Time to deliver customer value |
| Story points completed | Delivery predictability rate |
| PR count | Change failure rate |
| Hours worked | Cycle time from idea to production |
The left column measures activity. The right column measures outcomes. Activity metrics tell you people are busy. Outcome metrics tell you the business is benefiting.
🔥 Our Take
The moment you set LOC or commit count as a KPI, engineers will game it. Goodhart's Law is real: any measure that becomes a target ceases to be a good measure.
KPIs should measure outcomes that can't be easily gamed. Cycle time, change failure rate, and delivery predictability resist gaming because improving them requires actually improving the underlying process.
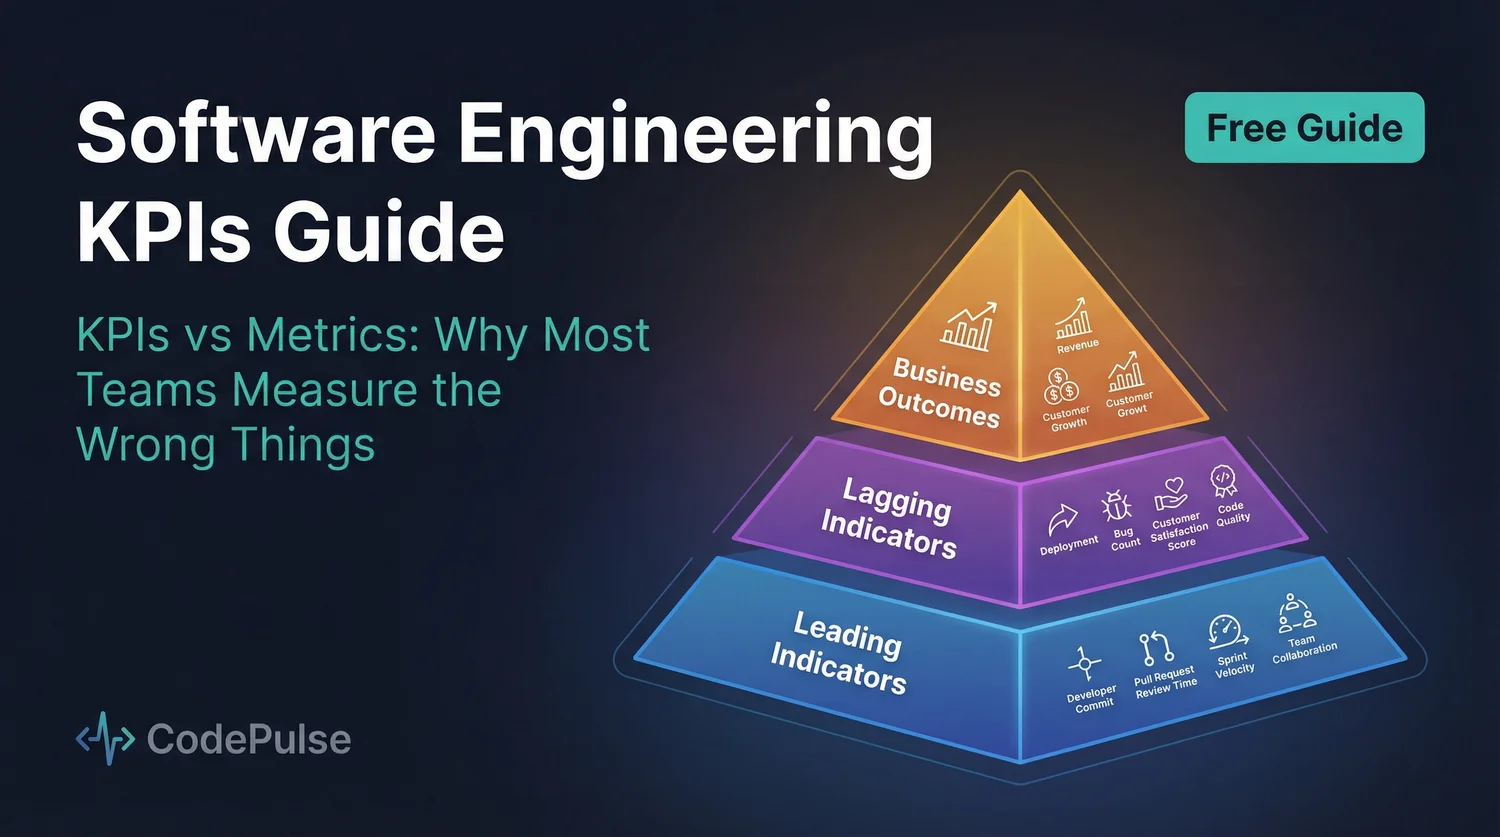
How Does the KPI Pyramid Framework Work?
We organize engineering KPIs into three tiers based on what they measure and how quickly they respond to changes.

Tier 1: Leading Indicators (Process Health)
Leading indicators change quickly and predict future outcomes. They're the metrics you can act on this week to improve results next month.
| Leading KPI | What It Predicts | Target |
|---|---|---|
| Cycle Time | Delivery speed and agility | < 72 hours |
| PR Size | Review quality and risk | < 400 lines |
| First Review Time | Team collaboration health | < 4 hours |
| Review Coverage | Code quality and knowledge sharing | > 95% |
According to LinearB's benchmarks, elite teams achieve merge frequencies above 2.25 per developer per week and maintain refactor rates below 11%. These leading indicators correlate strongly with delivery success.
Tier 2: Lagging Indicators (Delivery Performance)
Lagging indicators show results - but they take weeks or months to reflect changes. They're what you report to executives and use for quarterly planning.
| Lagging KPI | What It Shows | Target |
|---|---|---|
| Delivery Predictability | % of commitments met on time | > 80% |
| Change Failure Rate | % of deployments causing problems | < 15% |
| Deployment Frequency | How often you ship to production | Daily+ |
| MTTR | Time to recover from incidents | < 1 hour |
"Leading indicators are the levers. Lagging indicators are the results. If you only track lagging indicators, you're driving by looking in the rearview mirror."
Tier 3: Business Outcomes (Impact)
Business outcomes are the ultimate KPIs - but they're influenced by many factors beyond engineering. Use them for strategic alignment, not day-to-day optimization.
- Time to Market: From idea to customer value
- Feature Adoption: Usage of shipped features
- Customer-Reported Bugs: Quality as customers experience it
- Engineering Cost per Feature: Efficiency of investment
Why Are DORA Metrics the Industry Standard?
The DevOps Research and Assessment (DORA) group established four metrics that became the gold standard for software delivery performance. These are the most widely adopted engineering KPIs. Before adopting them organisation-wide, a structured DevOps assessment gives you the honest baseline of where your team sits today on each dimension. Read together, the four metrics describe delivery excellence: shipping fast and reliably without burning the team out to do it.
1. Deployment Frequency
How often new code is deployed to production. High-performing teams deploy multiple times per day - not because frequency is inherently good, but because it indicates small batch sizes and confidence in the delivery pipeline.
2. Lead Time for Changes
Time from code commit to running in production. Short lead times mean faster feedback and faster value delivery. The DORA benchmarks show elite teams achieve lead times under 24 hours.
3. Change Failure Rate
Percentage of deployments that cause failures requiring remediation. A low CFR (ideally less than 5%) indicates a reliable system. This is the quality counterbalance to velocity.
4. Mean Time to Recovery (MTTR)
Time to restore service after an incident. Elite teams restore service in less than 6 hours, while teams needing improvement take more than 30 hours.
For deep implementation guidance, see our DORA metrics guide. If you're weighing DORA against SPACE for a broader set of developer-experience signals, our DORA vs SPACE framework comparison lays out what each captures and misses.
🔥 Our Take
DORA metrics were designed for research across thousands of organizations - not as team KPIs. Using them as targets invites gaming.
Use DORA metrics to understand your current state and trajectory. Don't set "achieve elite status" as a goal - focus on the practices that naturally improve these metrics.
What KPI Anti-Patterns Should You Avoid?
Some metrics look useful but actively harm teams when used as KPIs.
Anti-Pattern 1: Lines of Code
LOC as a productivity KPI is embarrassing in the AI era. According to Cortex's analysis, basic metrics like lines of code fail to provide meaningful insights into team effectiveness.
Why it fails: More code isn't better code. The best solution is often deleting code. LOC encourages bloat and discourages refactoring.
Anti-Pattern 2: Story Points Velocity
Velocity is for capacity planning, not productivity measurement. The moment velocity becomes a KPI, teams inflate point estimates to look productive.
Why it fails: Story points are team-specific and subjective. Comparing velocity across teams is meaningless. Using it as a KPI destroys its planning value.
Anti-Pattern 3: Individual Developer Metrics
Ranking developers by commits, PRs, or code volume creates toxic competition and gaming. The best engineers often do invisible work: mentoring, architecture, unblocking others.
Why it fails: Individual metrics destroy trust and collaboration. They punish the very behaviors (helping others, reviewing thoroughly) that make teams effective.
Anti-Pattern 4: Hours Worked
Tracking hours encourages presenteeism, not productivity. Knowledge work doesn't scale linearly with time - some of the best solutions come after stepping away from the problem.
Why it fails: It measures input, not output. A developer who solves a problem in 2 hours is more valuable than one who struggles for 10.
📊Tracking Outcome-Based KPIs in CodePulse
CodePulse focuses on outcome metrics that resist gaming:
- Dashboard - Cycle time, deployment frequency, quality metrics
- Automatic breakdown of cycle time into actionable components
- Risk detection for merged-without-approval and failing tests
- Team-level metrics that encourage collaboration, not competition
How Does AI Change Which KPIs Matter?
With AI-assisted coding becoming mainstream, traditional productivity KPIs need reconsideration. As noted in Jellyfish's 2026 analysis, "While AI might cause your velocity to spike, higher velocity doesn't always mean more value. If you're shipping more features but they're buggy or the wrong features, AI has just helped you build the wrong thing faster."
What changes with AI:
- Code volume increases: LOC becomes even more meaningless
- Review quality matters more: AI-generated code needs human verification
- Cycle time should improve: AI accelerates coding, reducing that phase
- Change failure rate is the key: Speed without quality is just faster failure
"AI amplifies whatever your engineering culture already is. Good practices get faster. Bad practices fail faster. KPIs should focus on outcomes, not AI-assisted activity."
How Do You Implement KPIs Practically?
Step 1: Start with Business Goals
Before choosing KPIs, answer: What does the business need from engineering? Common answers:
- Ship faster: Focus on cycle time and deployment frequency
- Ship reliably: Focus on change failure rate and MTTR
- Reduce cost: Focus on efficiency metrics and tech debt ratio
- Improve predictability: Focus on delivery rate and planning accuracy
Step 2: Choose 3-5 KPIs Maximum
More KPIs means less focus. Pick the metrics that most directly reflect your business goals. A good starter set:
- Cycle Time (leading indicator)
- Change Failure Rate (quality counterbalance)
- Delivery Predictability (lagging indicator)
- Engineering Health Score (sustainability check)
Step 3: Establish Baselines
Measure your current state before setting targets. Most teams are surprised by their actual cycle time or change failure rate. Don't set arbitrary targets - understand your starting point.
Step 4: Focus on Improvement, Not Ranking
Track your trajectory, not absolute numbers. "We improved cycle time 20% this quarter" is more meaningful than "Our cycle time is 48 hours" without context.
Step 5: Review and Adapt
KPIs should evolve as your organization matures. A team focused on reliability might shift to speed once quality is stable. Revisit your KPI selection quarterly.
What Is the Bottom Line on Engineering KPIs?
The difference between teams that improve and teams that just measure is the difference between KPIs and metrics. KPIs connect to business outcomes. Metrics are just data.
Use the KPI Pyramid framework: track leading indicators weekly (cycle time, PR size, review speed), report lagging indicators monthly (delivery predictability, change failure rate), and align quarterly with business outcomes.
Avoid the anti-patterns: don't track LOC, velocity, or individual developer metrics as KPIs. Focus on outcomes that can't be gamed and require genuine process improvement.
For more on specific metric categories, see our comprehensive engineering metrics guide. For executive-level reporting, check our VP engineering metrics guide.
Frequently Asked Questions
A metric is any measurable data point (commits, PRs, lines of code). A KPI is a metric that directly reflects progress toward a business or team goal. All KPIs are metrics, but most metrics are not KPIs. The distinction matters because optimizing the wrong metric wastes effort and creates perverse incentives.
See these insights for your team
CodePulse connects to your GitHub and shows you actionable engineering metrics in minutes. No complex setup required.
Free tier available. No credit card required.
See These Features in Action
Board-ready engineering performance in a single page.
Track all four DORA metrics and benchmark against industry standards.
Break down cycle time into coding, waiting, review, and merge phases.
Related Guides
The Complete Guide to Engineering Metrics in 2026
Engineering metrics are everywhere, but most teams measure the wrong things. This guide covers what to measure, what to ignore, and how to build a metrics program that drives decisions - not just reports.
DORA Metrics Explained: The 4 Keys Without the Hype
A complete breakdown of the four DORA metrics - deployment frequency, lead time, change failure rate, and MTTR - with honest benchmarks and gaming traps to avoid.
VP Engineering Board Metrics: 7 Numbers That Defend Headcount
The 7 metrics VPs of Engineering need for board presentations: delivery predictability, investment allocation, and team health - with the language to present them.
Engineering Metrics That Won't Get You Reported to HR
An opinionated guide to implementing engineering metrics that build trust. Includes the Visibility Bias Framework, practical do/don't guidance, and a 30-day action plan.