See these metrics for your own team
CodePulse turns your GitHub history into engineering insights in about 5 minutes. Free to start, no credit card.
Get started freeGit data is evidence, not truth. Your commit history contains patterns that reveal process health, collaboration dynamics, and delivery flow - but it can't tell you who's productive, creative, or valuable. This guide explains what Git metrics can (and can't) tell you, and how to interpret them correctly.
What are the most important git metrics for engineering teams?
The most useful git metrics are PR cycle time (open to merge), code churn rate (rework within 14 days), commit frequency trends (team activity patterns), file change frequency (hotspot detection), and contributor distribution (knowledge silo risk). Raw git metrics like commit counts and lines of code are misleading because they reward volume over value. Focus on metrics derived from PR workflows rather than raw commit data. CodePulse calculates all of these from your GitHub repositories automatically.
Our Take
Treating commit history as a productivity scorecard is a category error. Git tracks activity, not value. The most valuable engineering work - design, architecture, mentoring, debugging - often produces the fewest commits. Use Git data to understand your process, not to evaluate your people.
What Git Actually Tracks
Before interpreting Git metrics, understand what Git records and what it doesn't. Git is a version control system, not a productivity measurement system.
What Git Records
- Commits (author, timestamp, message, diff)
- Branches and merge history
- Lines added, removed, modified
- Files changed per commit
- Pull request events (open, review, merge)
- Review comments and approvals
What Git Doesn't Record
- Time spent thinking, designing, planning
- Difficulty or complexity of work
- Value created for users or business
- Mentoring, pairing, helping teammates
- Research, investigation, debugging
- Code quality (only quantity)
The gap between what Git records and what matters is enormous. An engineer who spends a week debugging a critical issue might produce 3 commits. Another who copies and pastes boilerplate might produce 50. Git can't tell which is more valuable.
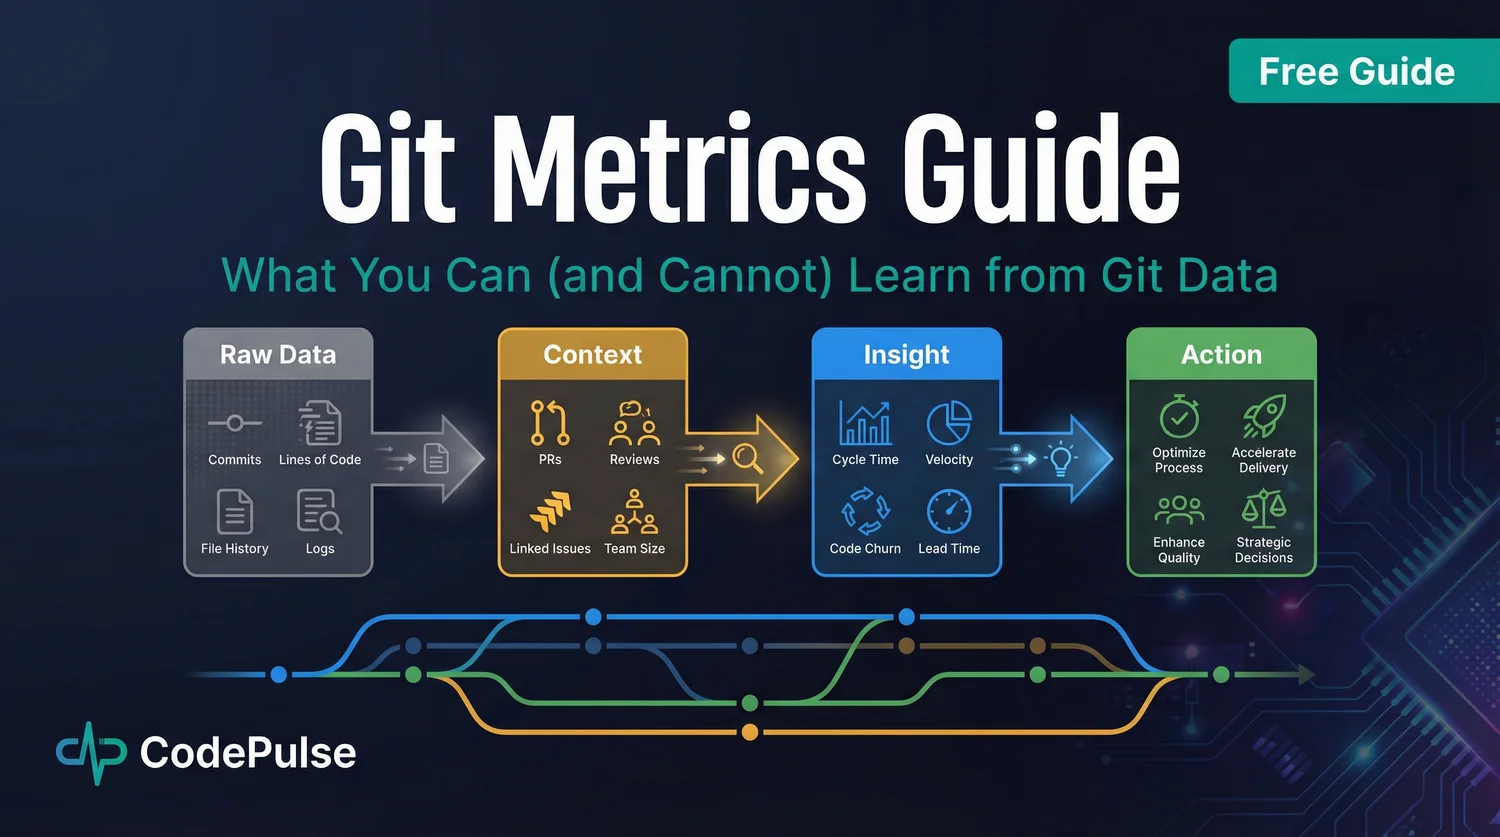
The Git Data Interpretation Model
Raw Git data is meaningless without context. The same metric can indicate success or failure depending on the situation. Here's a framework for moving from raw data to actionable insight.

Stage 1: Raw Data
Git gives you numbers: commits, lines changed, PR events. These numbers alone mean nothing. 100 lines of code could be a critical bug fix or unnecessary bloat.
Stage 2: Add Context
Context transforms data into information. Questions to ask:
- What phase is the project in? (Greenfield vs. maintenance)
- What are team norms? (Small PRs vs. large features)
- What's happening in the business? (Launch pressure vs. steady state)
- What's the technical environment? (Monorepo vs. multi-repo)
Stage 3: Extract Insight
With context, patterns become insights. Not "engineer X has low commit count" but "our review process has a bottleneck" or "work is concentrated on 2 people."
Stage 4: Take Action
Insights should lead to process improvements, not individual evaluations. Rebalance load, fix bottlenecks, invest in tooling - don't rank engineers.
Git Metrics That Actually Help
Some Git-derived metrics provide genuine process insight when interpreted correctly. Here are the most valuable ones. When the data looks clean but your team is still stalling, our engineering workflow friction guide covers the non-obvious causes these metrics surface - review queues, reviewer fan-in, environment wait time, and the rest.
Cycle Time
Cycle time measures how long work takes from start to finish - typically from first commit to production deploy. According to the 2025 Software Engineering Benchmarks report, elite teams have cycle time under 26 hours.
Cycle Time Breakdown
- Coding Time: First commit → PR opened
- Pickup Time: PR opened → First review
- Review Time: First review → Approval
- Deploy Time: Approval → Production
Pro tip: Most cycle time is wait time, not work time. Focus on reducing idle phases.
Deep dive: Breaking down cycle time →
PR Size and Throughput
Smaller PRs merge faster and have fewer defects. Track the distribution of PR sizes and encourage smaller, focused changes.
| PR Size | Lines Changed | Typical Review Time | Defect Probability |
|---|---|---|---|
| Small | <200 lines | <1 hour | Low |
| Medium | 200-500 lines | 1-4 hours | Medium |
| Large | >500 lines | Days (or rubber-stamped) | High |
Review Load Distribution
Who reviews code, and how is the load distributed? Uneven distribution creates bottlenecks and burnout. Track reviews per engineer and intervene when someone becomes overloaded.
Knowledge Distribution (Bus Factor)
Who knows what parts of the codebase? If only one person has touched a critical module, you have a knowledge silo and bus factor risk. Git history reveals these patterns.
Learn more: Detecting knowledge silos →
"Teams with faster code reviews have 50% higher software delivery performance. Review turnaround is one of the highest-leverage metrics you can track."
See Your Git Patterns Clearly
CodePulse transforms your Git history into actionable insights: cycle time breakdowns, review load distribution, and knowledge silos - without individual surveillance.
Dangerous Metrics to Avoid
Some Git metrics look useful but create perverse incentives or misleading conclusions. Avoid using these as KPIs or performance indicators.
⚠️ Metrics That Cause Harm
Lines of Code (LOC)
More code isn't better code. Rewarding LOC produces bloat, not value. The best fix is often deleting code.
Commit Counts
Easy to game (split work into micro-commits). A single well-crafted commit is worth more than 10 trivial ones.
Individual Velocity Rankings
Comparing engineers by output destroys collaboration. The engineer helping everyone else looks "unproductive."
PR Merge Speed (Without Quality)
Optimizing merge speed without tracking quality produces fast failures. Rushed reviews catch fewer bugs.
Our Take
Any metric used as a target will be gamed. The moment you tell engineers their performance review depends on commit counts or lines of code, you've poisoned your data and your culture. Use Git metrics to understand process health, never to evaluate individuals.
The Work Git Can't See
A significant portion of engineering value creation is invisible to Git. Ignoring this work biases you toward valuing "hands on keyboard" over thinking and collaboration.
Design and Architecture
The engineer who designs a clean architecture might produce few commits but prevents months of technical debt. This work shows up in documents, whiteboard sessions, and discussions - not Git.
Mentoring and Unblocking
Senior engineers who spend time unblocking juniors "lose" coding time but multiply team output. Their Git metrics look worse while their impact is higher.
Investigation and Debugging
Debugging a complex issue might take days of investigation for a 5-line fix. The Git history shows a tiny commit; it doesn't show the expertise and persistence behind it.
Research and Learning
Time spent evaluating technologies, reading documentation, and staying current produces no commits but prevents future problems.
"One of the most significant drawbacks of Git Analytics is the assumption that high activity means high productivity. Many lines of code could be unnecessary bloat instead of well-structured, efficient solutions."
Team Patterns vs. Individual Metrics
The right unit of analysis for Git metrics is the team, not the individual. Team-level patterns reveal process issues without creating surveillance culture.
✅ Team-Level Questions
- Is our cycle time improving or degrading?
- Is review load evenly distributed?
- Do we have knowledge silos?
- Are PRs getting smaller or larger?
- Where are our process bottlenecks?
❌ Individual Comparisons
- Who has the most commits?
- Who produces the most code?
- Who reviews the fastest?
- Who has the highest "productivity score"?
- Who's "underperforming"?
Implementing Git Analytics Responsibly
If you decide to use Git analytics, do it responsibly. Here's a framework for ethical implementation.
Principle 1: Transparency
Share what you're measuring with the team. Let engineers see their own data. No secret dashboards comparing individuals.
Principle 2: Process Focus
Use metrics to improve processes, not to evaluate people. "Our review bottleneck is in the frontend team" not "Sarah is slow at reviewing."
Principle 3: Context Required
Never interpret metrics without context. A spike in cycle time might mean a complex project, not a failing team.
Principle 4: No Individual Ranking
Never create leaderboards or rankings based on Git metrics. This destroys collaboration and creates toxic competition.
Principle 5: Combine with Qualitative Data
Use Git metrics alongside surveys, 1:1 conversations, and retrospectives. Numbers alone don't tell the story.
Common Interpretation Mistakes
Even well-intentioned Git analytics can go wrong. Here are the most common interpretation errors.
Mistake 1: Confusing Correlation with Causation
"Engineers with more commits have fewer bugs" doesn't mean commits prevent bugs. It might mean those engineers work on less complex code.
Mistake 2: Ignoring Survivorship Bias
You only see commits that made it to the repo. You don't see abandoned approaches, investigation that led nowhere, or work that was discarded.
Mistake 3: Snapshot vs. Trend
A single data point means nothing. Look at trends over weeks or months, not daily or weekly snapshots.
Mistake 4: Comparing Apples and Oranges
An engineer working on a greenfield project will have different metrics than one maintaining legacy code. Don't compare across different contexts.
Git Metrics in the AI Era
AI coding assistants are changing what Git metrics mean. A 2025 analysis of 70,000 developer-years of data examined how AI tools affect code patterns.
AI Impact on Git Metrics
- Higher LOC: AI assistants produce more code, but not necessarily better code
- Changed patterns: More boilerplate, potentially more code churn
- Attribution questions: Who "wrote" AI-assisted code?
- Quality signals shift: Traditional code quality metrics need recalibration
As AI tools become standard, historical benchmarks become less relevant. The interpretation of Git metrics must evolve with tooling.
Process Intelligence, Not Surveillance
CodePulse focuses on team-level patterns and process health - cycle time, review flow, knowledge distribution - without individual productivity scoring.
Conclusion: Git Data as a Tool, Not a Judge
Git metrics are a lens into your development process, not a scorecard for your engineers. Used correctly, they reveal bottlenecks, collaboration patterns, and improvement opportunities. Used incorrectly, they create gaming, anxiety, and toxicity.
The key is remembering what Git can and can't see. It tracks activity, not value. It records commits, not thinking. It measures code volume, not code quality. Keep these limitations in mind, and Git analytics becomes a powerful tool for process improvement.
Final Take
The best Git analytics answer "how is our process working?" not "who is productive?" If you're using Git data to rank engineers, you've already failed. Use it to find bottlenecks, balance workload, and improve flow - and let humans evaluate humans.
Related Resources
- The Complete Guide to Engineering Metrics
- Cycle Time Breakdown: Where Your Time Actually Goes
- Code Hotspots and Knowledge Silos
- Building Trust with Engineering Metrics
Git Insights Without Surveillance
CodePulse transforms your Git history into process insights - cycle time, review patterns, collaboration health - without individual productivity scoring.
Free tier available. No credit card required.
Frequently Asked Questions
Focus on PR cycle time (open to merge), code churn rate (rework within 14 days), commit frequency trends, file change frequency for hotspot detection, and contributor distribution for knowledge silo risk. These reveal process health without rewarding volume.
See these insights for your team
CodePulse connects to your GitHub and shows you actionable engineering metrics in minutes. No complex setup required.
Free tier available. No credit card required.
See These Features in Action
Board-ready engineering performance in a single page.
Break down cycle time into coding, waiting, review, and merge phases.
Related Guides
GitHub Metrics: What to Track and What to Ignore
GitHub is a goldmine of engineering data. This guide shows which GitHub metrics actually matter (PR cycle time, review load, knowledge distribution), how to build a useful dashboard, and which vanity metrics to avoid.
GitHub Is Hiding Your Repo's Real Health Score
Learn which repository-level metrics matter for engineering managers and staff engineers, how to track them across multiple repos, and when to intervene based on health signals.
The Complete Guide to Engineering Metrics in 2026
Engineering metrics are everywhere, but most teams measure the wrong things. This guide covers what to measure, what to ignore, and how to build a metrics program that drives decisions - not just reports.
The 'Bus Factor' File That Could Kill Your Project
Use the Bus Factor Risk Matrix to identify where knowledge concentration creates hidden vulnerabilities before someone leaves.