See these metrics for your own team
CodePulse turns your GitHub history into engineering insights in about 5 minutes. Free to start, no credit card.
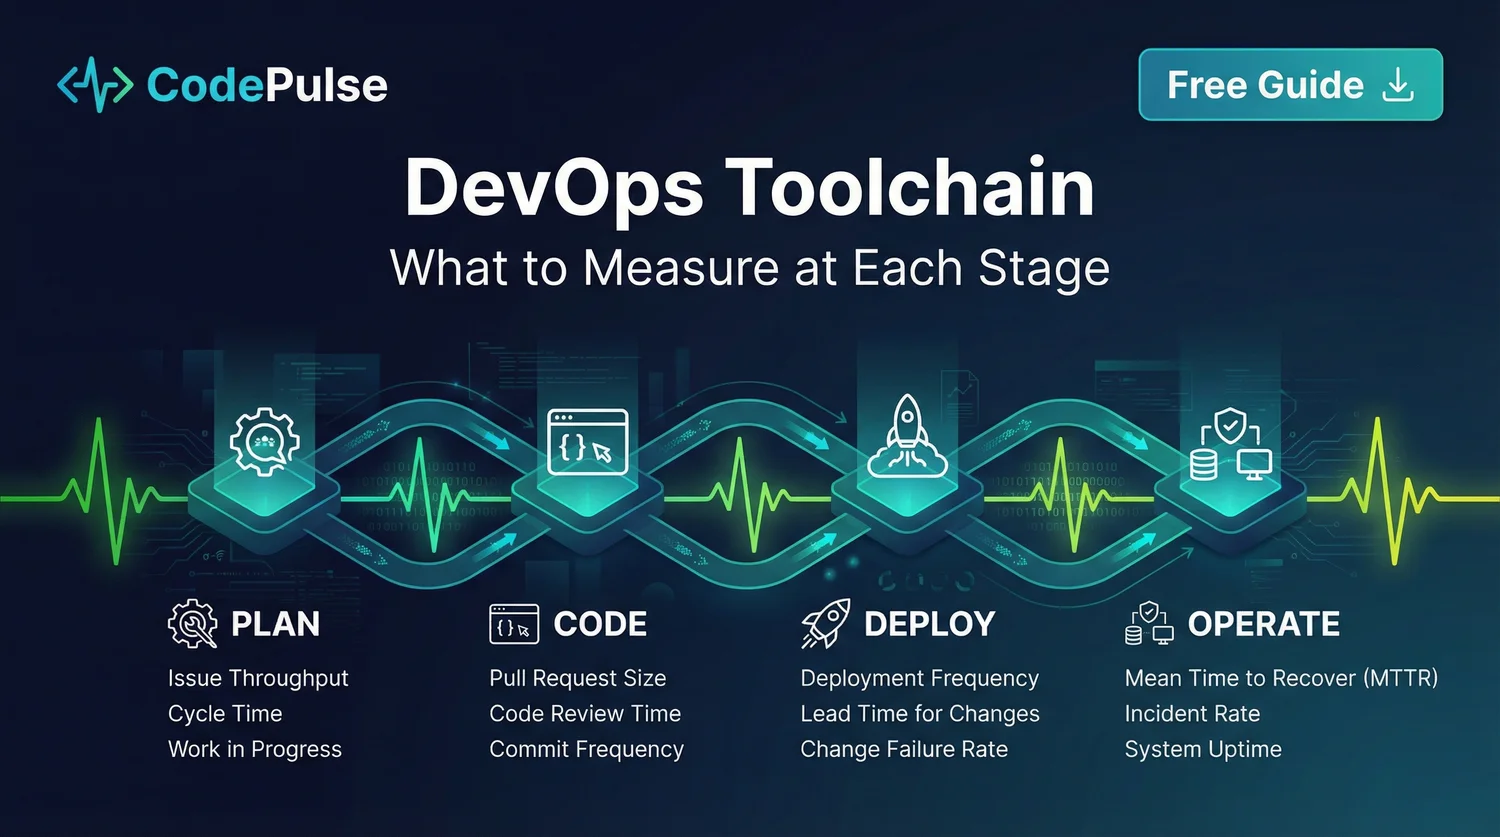
Get started freeA DevOps toolchain is the collection of tools that enable continuous integration, delivery, and operations. This guide maps out the complete toolchain, what to measure at each stage, and how to evaluate tool effectiveness.
"The best toolchain is the one your team actually uses. Tool count is vanity. Tool adoption is sanity."
DevOps Toolchain Stages

Tools and Metrics by Stage
1. Plan
| Tool Type | Examples | Key Metrics |
|---|---|---|
| Project Management | Jira, Linear, Azure Boards, GitHub Issues | Cycle time, lead time, throughput |
| Documentation | Confluence, Notion, GitBook | Doc freshness, coverage |
2. Code
| Tool Type | Examples | Key Metrics |
|---|---|---|
| Source Control | GitHub, GitLab, Bitbucket | Commit frequency, PR cycle time |
| Code Review | GitHub PRs, GitLab MRs, Gerrit | Review time, reviewer load |
| IDE/Editor | VS Code, JetBrains, Vim | Adoption rate |
3. Build
| Tool Type | Examples | Key Metrics |
|---|---|---|
| CI Platforms | GitHub Actions, GitLab CI, Jenkins, CircleCI | Build time, success rate |
| Artifact Storage | Artifactory, Nexus, ECR, GCR | Storage costs, retention |
4. Test
| Tool Type | Examples | Key Metrics |
|---|---|---|
| Unit Testing | Jest, Pytest, JUnit, Go test | Coverage, pass rate |
| E2E Testing | Cypress, Playwright, Selenium | Flaky rate, duration |
| Security Scanning | Snyk, SonarQube, Dependabot | Vulnerabilities found |
5. Release & Deploy
| Tool Type | Examples | Key Metrics |
|---|---|---|
| CD Platforms | ArgoCD, Spinnaker, Octopus | Deployment frequency, lead time |
| Feature Flags | LaunchDarkly, Flagsmith, Split | Flag usage, rollout % |
| IaC | Terraform, Pulumi, CloudFormation | Apply success, drift rate |
6. Operate & Monitor
| Tool Type | Examples | Key Metrics |
|---|---|---|
| Monitoring | Datadog, Prometheus, New Relic | MTTR, alert noise ratio |
| Incident Management | PagerDuty, OpsGenie, FireHydrant | MTTA, MTTR, incident count |
| Logging | ELK, Splunk, Datadog Logs | Query latency, retention |
/// Our Take
Tool sprawl is the enemy. Integrated platforms beat best-of-breed in most cases.
The toolchain with 15 tools and 15 integrations to maintain is harder to use than GitHub + GitHub Actions + a good monitoring solution. Choose integrated platforms when possible. Only go best-of-breed when you have the team to support it.
Measuring Toolchain Effectiveness
Track these cross-cutting metrics:
| Metric | What It Measures | Target |
|---|---|---|
| Tool Adoption Rate | % of teams using standard toolchain | >90% |
| Integration Health | % uptime of tool integrations | >99.5% |
| Context Switching | Number of tools to complete a task | <3 for common workflows |
| Toolchain Cost | Per-developer tooling spend | Varies (track trend) |
📊 How to Track This in CodePulse
CodePulse provides the engineering analytics layer for your toolchain:
- Code stage: PR cycle time, review load, collaboration patterns
- Deploy stage: Deployment frequency, lead time
- Operate stage: Change failure rate, time to recovery
View your Dashboard for cross-toolchain delivery metrics.
Common Toolchain Pitfalls
Pitfall 1: Shiny Object Syndrome
New tools are exciting. Migration projects are expensive. Evaluate whether the improvement justifies the switching cost before adopting new tools.
Pitfall 2: No Standard Toolchain
When every team picks their own tools, you can't share knowledge, modules, or automation. Standardize the core toolchain, allow flexibility at the edges.
Pitfall 3: Ignoring Developer Experience
A tool that management loves but developers hate will be circumvented. Measure developer satisfaction with tooling, not just technical metrics.
Related Guides
- DevOps Automation Metrics Guide - Measuring automation at each stage
- Engineering Analytics Tools Comparison - Analytics layer options
- DORA Metrics Guide - Cross-toolchain delivery metrics
Conclusion
Your DevOps toolchain should enable fast, reliable delivery with minimal friction. Map your current tools to the stages, identify gaps, and measure effectiveness. Remember: the best toolchain is one your team uses consistently.
"A smaller, integrated toolchain that teams actually use beats a comprehensive toolchain that nobody understands."
Track your delivery metrics across the toolchain with CodePulse.
See these insights for your team
CodePulse connects to your GitHub and shows you actionable engineering metrics in minutes. No complex setup required.
Free tier available. No credit card required.
See These Features in Action
Track deployment frequency, lead time, and release patterns.
Track all four DORA metrics and benchmark against industry standards.
Related Guides
DevOps Automation: How to Measure What Actually Matters
DevOps automation promises faster delivery and fewer errors. This guide covers the metrics that prove automation ROI, what to automate first, and how to calculate the business impact.
Jellyfish vs LinearB vs Swarmia: Full 2026 Comparison
Compare Jellyfish, LinearB, Swarmia, Allstacks, Haystack and more engineering analytics tools. Features, pricing, cycle time benchmarks, and integrations.
DORA Metrics Explained: The 4 Keys Without the Hype
A complete breakdown of the four DORA metrics - deployment frequency, lead time, change failure rate, and MTTR - with honest benchmarks and gaming traps to avoid.
Azure DevOps vs GitHub: 2026 Comparison (Both Tested)
Azure DevOps vs GitHub compared: pricing, CI/CD, AI features, project management, analytics, and migration paths. Side-by-side guide for engineering leaders choosing between Microsoft platforms.