See these metrics for your own team
CodePulse turns your GitHub history into engineering insights in about 5 minutes. Free to start, no credit card.
Get started freeYou've connected your repositories to CodePulse. Now what? This guide walks you through getting maximum value from your trial - from your first dashboard view to identifying quick wins your team can act on immediately.
VPs get high-level visibility, Engineering Managers can track team velocity, and Principal Engineers can investigate code health - all with actionable insights within minutes.
What to Expect from Your Trial
CodePulse analyzes your GitHub data to surface patterns that matter. Within your 14-day trial, you'll have access to:
- Real-time metrics: Cycle time, deployment frequency, review coverage, and more - updated automatically
- Code health insights: File hotspots, knowledge silos, and risky change patterns
- Team visibility: Review network visualization, workload distribution, and collaboration patterns
- Executive-ready reports: Board-level summaries and DORA metrics for leadership conversations
⏱️ Sync Timeline
Initial sync imports 6 months of history. Most repositories complete within 5–15 minutes. Larger monorepos may take longer. You'll see data start appearing immediately as the sync progresses.
Step 1: Your First Look at the Dashboard
The Dashboard is your home base. It provides a comprehensive health score and highlights areas needing attention.
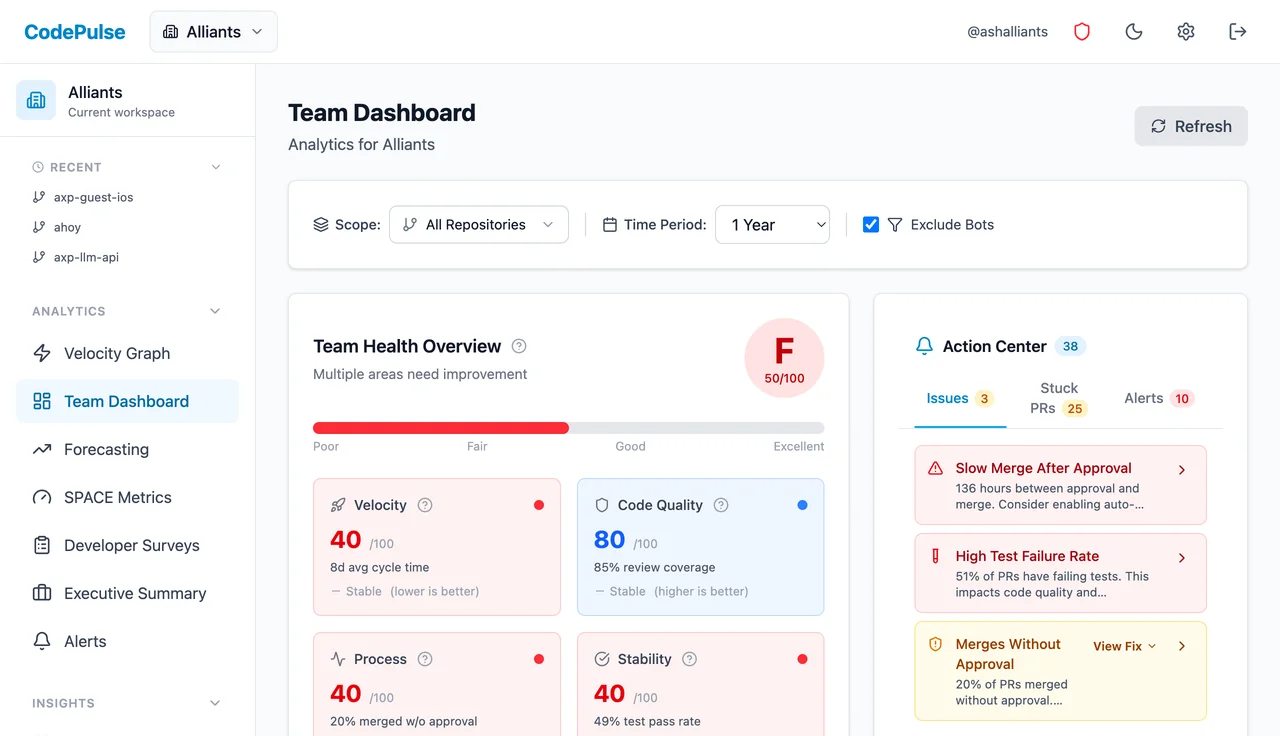
Key Sections to Review
- Team Health Overview: A 0-100 score across Velocity, Code Quality, Process, and Stability. Green is good, red needs attention.
- DORA Metrics: Deploy frequency, lead time, change failure rate, and MTTR benchmarked against industry standards.
- Action Center: Issues, stuck PRs, and alerts that need immediate attention - sorted by priority.
- Cycle Time Breakdown: See exactly where time goes: coding, waiting for review, in review, or waiting to merge.
💡 Quick Win: Cycle Time Breakdown
The Cycle Time Breakdown chart often reveals your biggest bottleneck immediately. If "Waiting for Review" or "Merge" dominates, you've found where to focus first.
Step 2: Explore the Velocity Graph
The Velocity Graph gives you an at-a-glance view of your team's overall engineering performance across four key dimensions, displayed as a radial score chart.
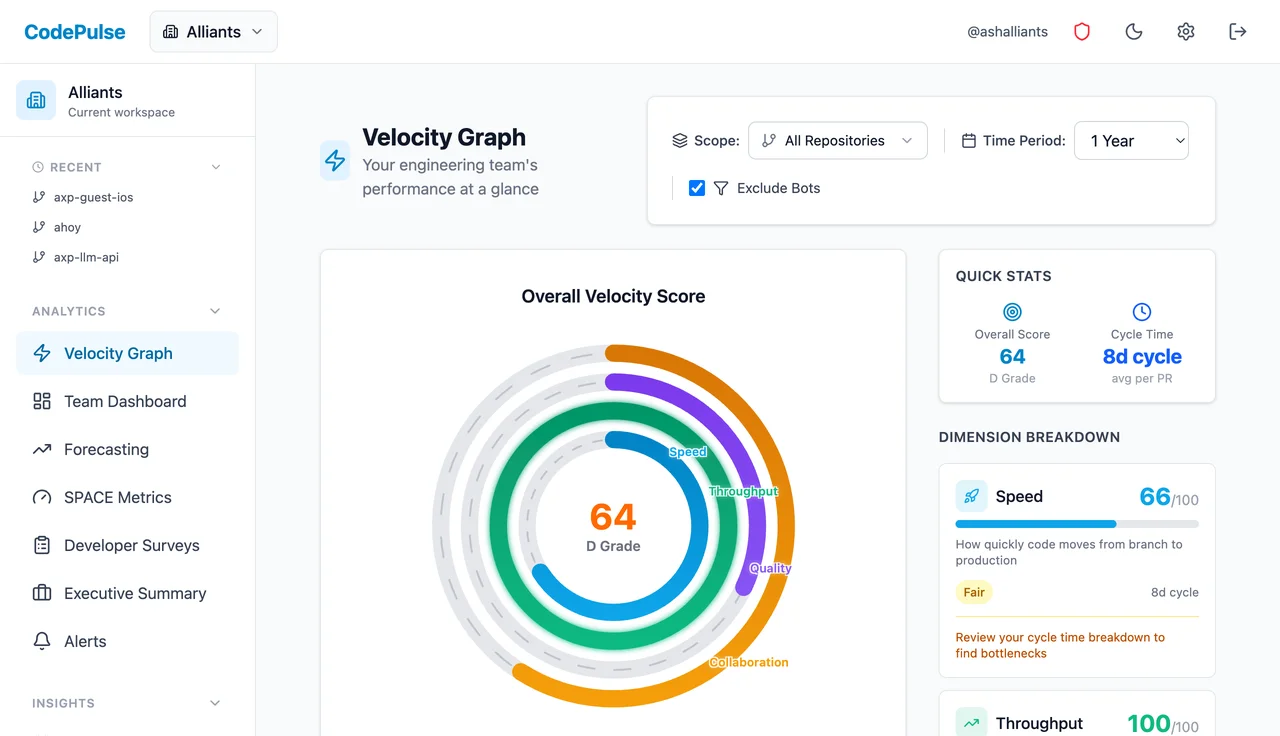
The Four Dimensions
- Speed: How quickly code moves from branch to production. A low score here means PRs are taking too long to merge - check your cycle time breakdown.
- Throughput: The volume of work getting done. High throughput with low speed might indicate lots of small PRs stuck in review.
- Quality: Review coverage, test pass rates, and code review depth. Low quality scores often correlate with rushed merges or skipped reviews.
- Collaboration: How well the team shares review load and knowledge. A low score might indicate silos or review bottlenecks.
📈 Pro Tip: Follow the Weakest Ring
Your overall score is limited by your weakest dimension. Look at which ring is shortest - that's where to focus first. The dimension breakdown on the right shows specific scores and actionable recommendations for each area.
Step 3: Check Your Repositories
Visit the Repositories page to see all connected repos and their sync status.
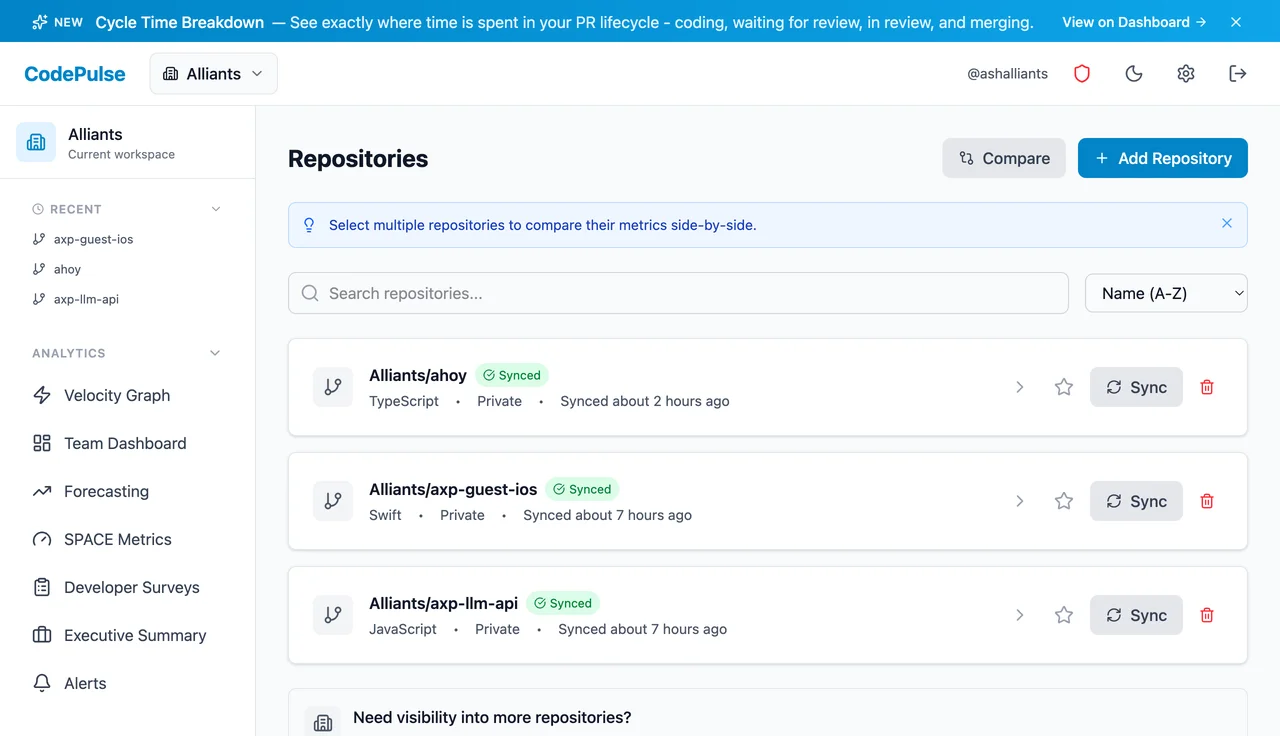
What to Check
- Sync status: Green "Synced" badge means data is current. Yellow means syncing is in progress.
- Last synced time: Data refreshes automatically every 15 minutes.
- Missing repos? Click "Add Repository" to connect more. You can add individual repos or connect another GitHub organization.
Click any repository to see its individual metrics and recent PR activity.
Step 4: Understand Your Code Health
Two pages help you identify technical risk before it becomes a problem:
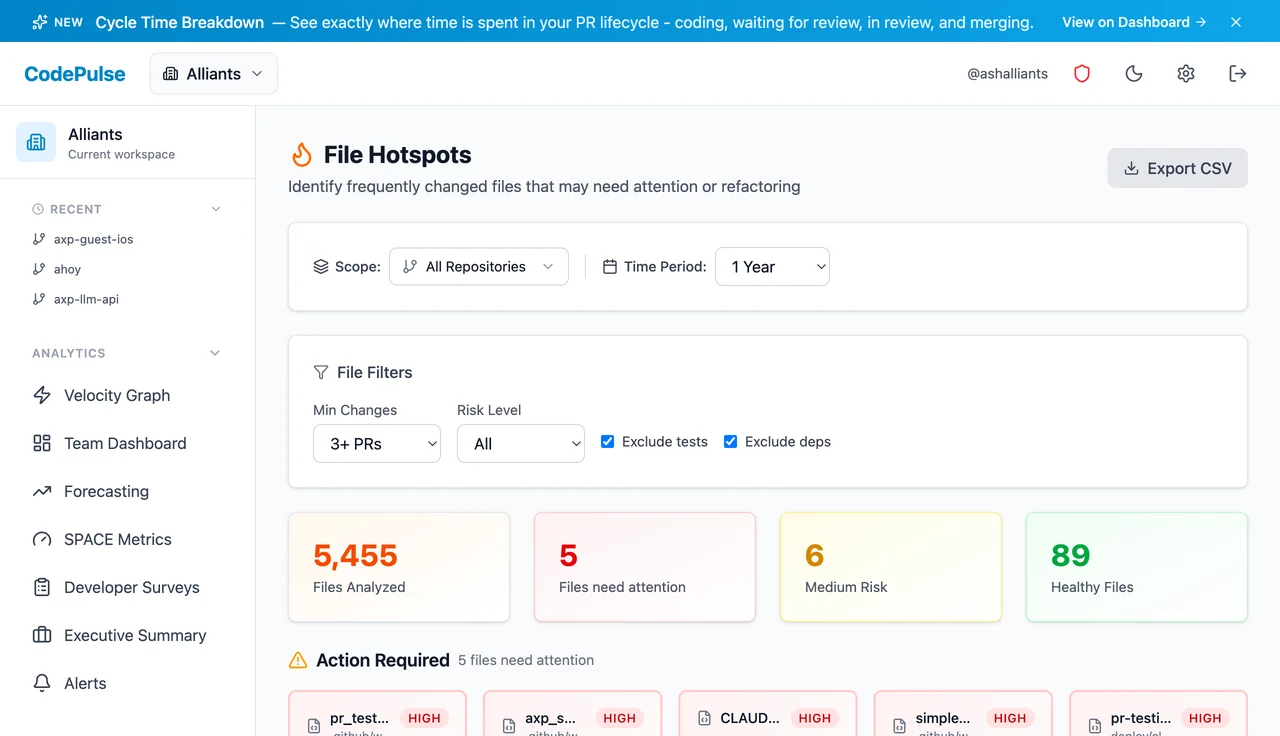
File Hotspots
The File Hotspots page shows which files change most frequently and involve the most churn. High-churn files often indicate:
- Technical debt accumulation
- Poorly architected modules that need refactoring
- Configuration files that should be templated
- Merge conflict magnets that slow everyone down
Knowledge Silos
The Knowledge Silos page identifies files and directories where only one or two developers have made changes. This is your "bus factor" risk - what happens if that person leaves?
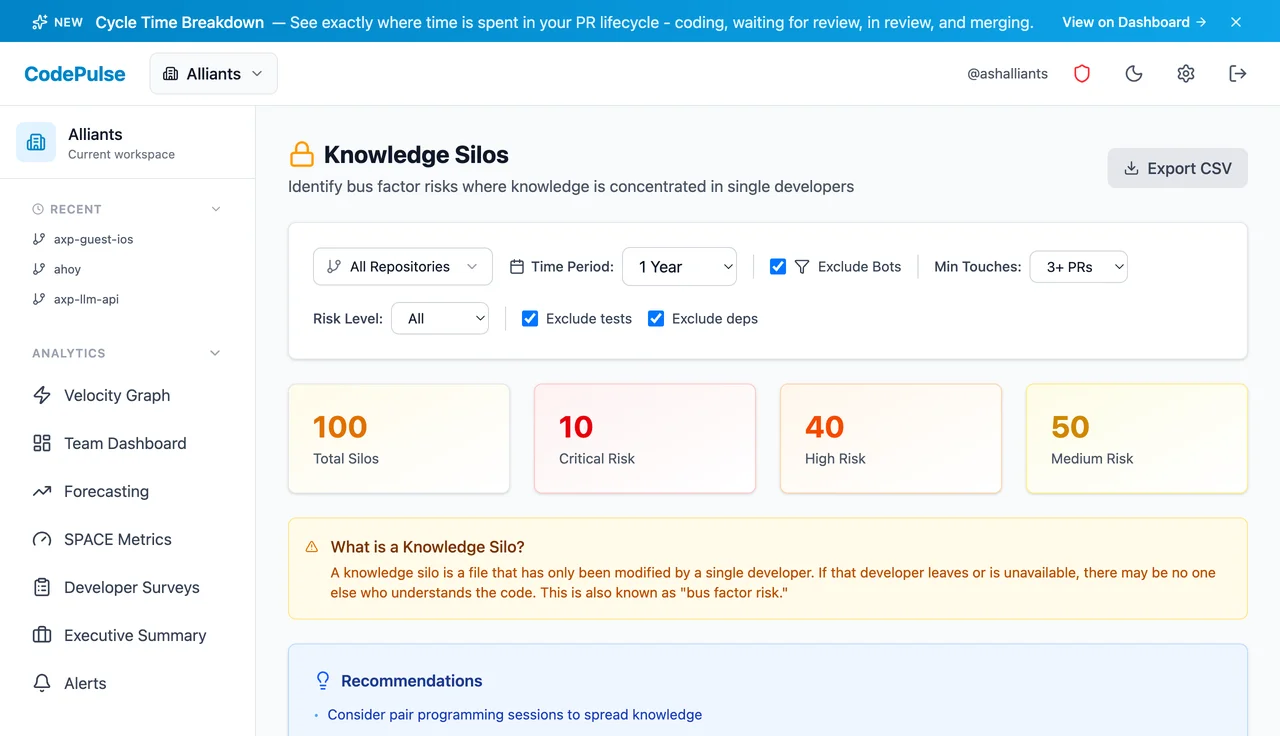
🎯 Our Take
Don't panic if you see silos - they're normal. The goal isn't to eliminate them entirely, but to be aware of them. When planning work, consider pairing junior developers with silo owners for knowledge transfer. When someone gives notice, check their silos first.
Step 5: Spot Review Bottlenecks
The Review Network page visualizes who reviews whose code. Look for:
- Review bottlenecks: One person receiving all review requests
- Isolated developers: Team members who don't participate in reviews
- Cross-team collaboration: Are teams siloed or sharing knowledge?
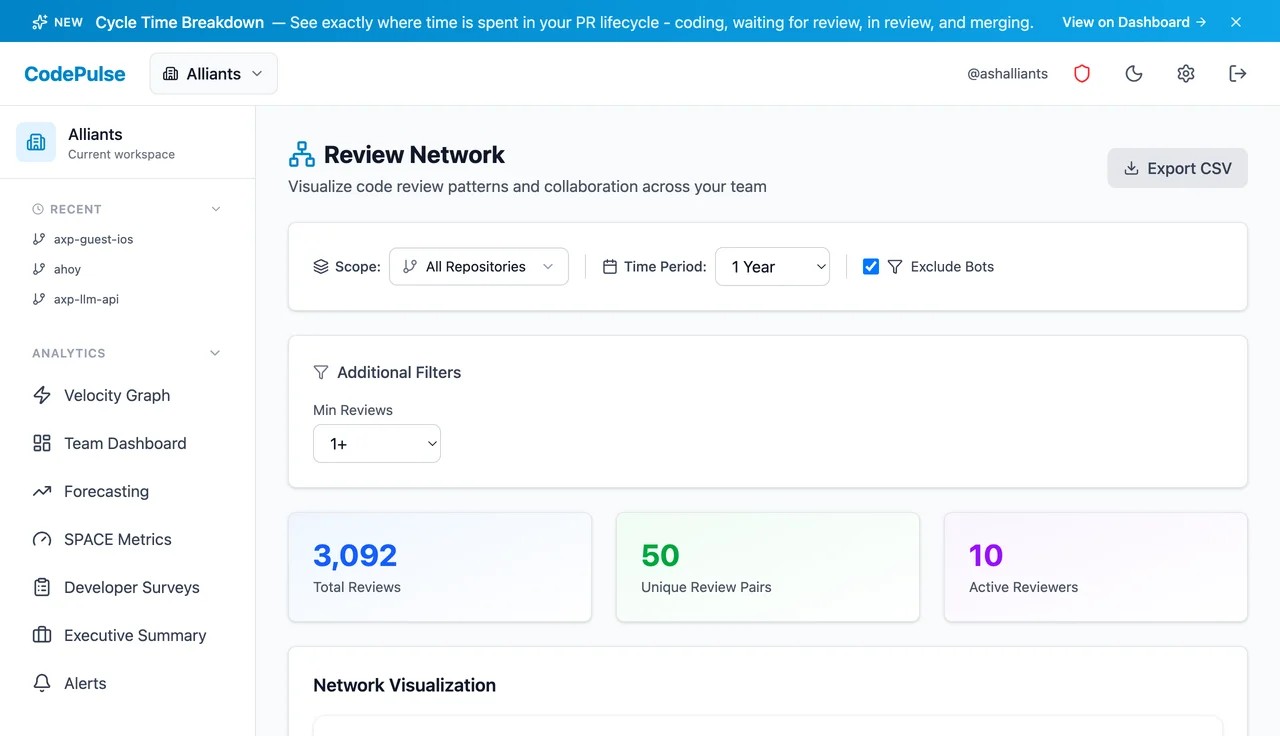
Healthy teams show a well-connected graph with review work distributed across multiple people. Unhealthy patterns show one or two people at the center of all reviews - a bottleneck that slows everyone down.
Step 6: For Leadership: Executive Summary
The Executive Summary page provides a board-ready view of engineering performance. Perfect for:
- Weekly leadership standups
- Monthly board reports
- Quarterly business reviews
- Headcount justification conversations
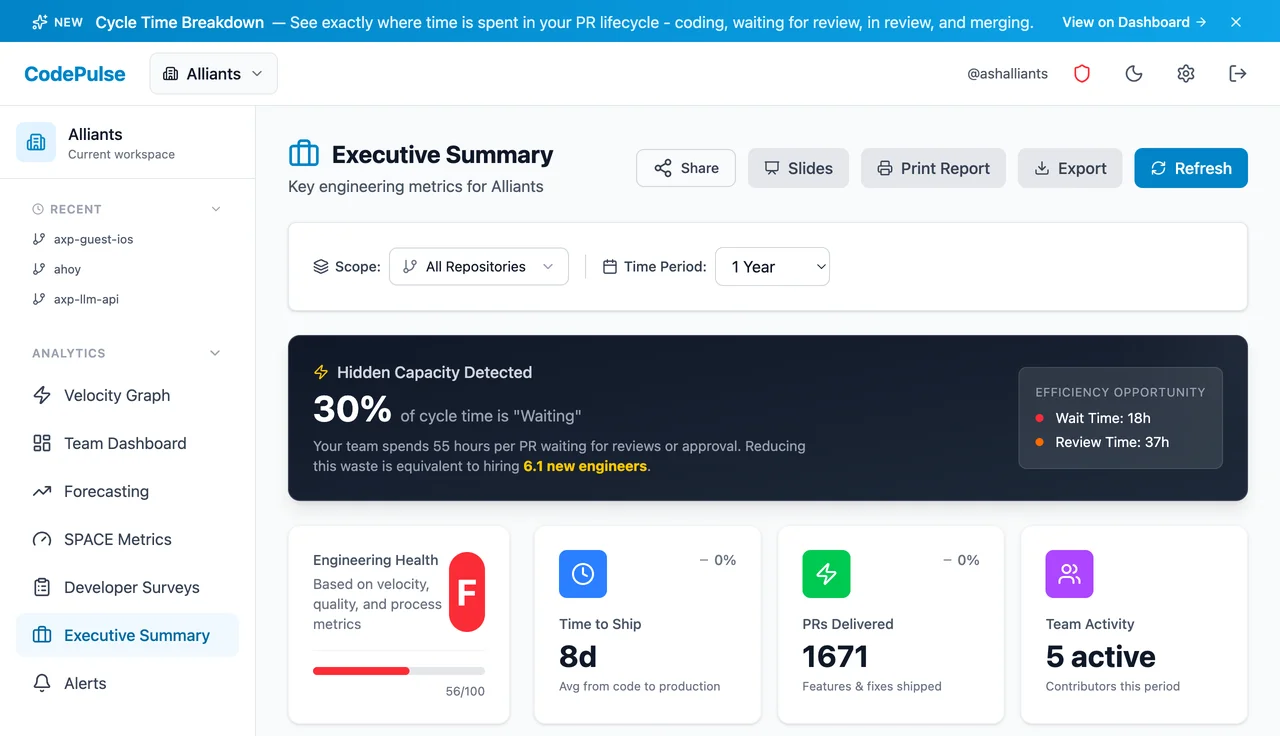
Key Insight Callouts
What makes the Executive Summary powerful is its automatic issue detection. The page highlights specific problems that need attention:
- High-impact issues: Developers with declining output, PRs stuck for extended periods, review bottlenecks affecting throughput
- Trend alerts: Metrics moving in the wrong direction compared to previous periods
- Risk signals: Knowledge silos in critical code paths, high-churn files that might need refactoring
This view focuses on trends over time, helping you show progress rather than just snapshots. The data exports cleanly to slides or reports.
Step 7: Find Your First Quick Wins
By now, you've likely spotted a few patterns. Here's how to turn insights into action:
If Cycle Time is High (7+ days average)
- Check the Cycle Time Breakdown to identify the biggest phase
- If "Waiting for Review" is high → set up review SLAs or assign more reviewers
- If "Merge" phase is high → enable auto-merge for approved PRs
- If "Coding" is high → PRs may be too large; encourage smaller, incremental changes
If Knowledge Silos are Severe
- Identify your top 3 riskiest silos
- Schedule pair programming sessions to spread knowledge
- Require a second reviewer from outside the team for critical files
- Document architectural decisions for these areas
If Review Coverage is Low (<80%)
- Enable branch protection rules requiring reviews
- Set up CODEOWNERS for critical paths
- Consider whether merges-without-review are intentional or accidental
What's Next?
You've completed your first tour of CodePulse. Here's how to get more value:
- Set up alerts: Visit Alerts to get notified when PRs are stuck or metrics drift
- Invite your team: Go to Access to add colleagues who should have visibility
- Explore more pages: Check out Velocity Graph, Risky Changes, and Year in Review
- Book a walkthrough: Want a personalized tour of your data? Schedule 15 minutes with our team
🤝 Our Philosophy
CodePulse exists to give engineering teams visibility, not surveillance. We believe metrics should help teams improve - never to punish individuals. Use these insights to start conversations, identify systemic issues, and celebrate progress. Velocity should never be a goal.
Questions? We're Here
Running into issues or want guidance on interpreting your metrics? We're happy to help:
- Email: support@codepulsehq.com
- Book a call: 15-minute walkthrough
Your trial has full access to all features. No credit card required. If CodePulse helps your team ship faster and healthier, we'd love to continue working together.
See these metrics for your team
CodePulse connects to your GitHub and shows you actionable engineering insights in minutes. No complex setup required.
Get started freeSee these insights for your team
CodePulse connects to your GitHub and shows you actionable engineering metrics in minutes. No complex setup required.
Free tier available. No credit card required.
See These Features in Action
Explore all featuresRelated Guides
The GitHub Permission Mistake That Gets Security Rejected
Understand GitHub OAuth scopes and app permissions required for engineering analytics tools, with security best practices.
We Cut PR Cycle Time by 47%. Here's the Exact Playbook
A practical playbook for engineering managers to identify bottlenecks, improve review processes, and ship code faster - without sacrificing review quality.
The 'Bus Factor' File That Could Kill Your Project
Use the Bus Factor Risk Matrix to identify where knowledge concentration creates hidden vulnerabilities before someone leaves.
DORA Metrics Explained: The 4 Keys Without the Hype
A complete breakdown of the four DORA metrics - deployment frequency, lead time, change failure rate, and MTTR - with honest benchmarks and gaming traps to avoid.