See these metrics for your own team
CodePulse turns your GitHub history into engineering insights in about 5 minutes. Free to start, no credit card.
Get started freeEngineering managers face an impossible job: deliver results while keeping a team of knowledge workers healthy, engaged, and growing. Most "management metrics" make this harder, not easier. This guide covers what to actually track, what to ignore completely, and how to use data without destroying trust.
"The best leading indicator of team problems isn't low output - it's high output at unusual hours. That's not dedication. That's a warning sign."
The Burnout Crisis You're Probably Missing
Here's the uncomfortable truth: your team is probably burning out, and you don't know it. The numbers are staggering:
- 83% of developers suffer from burnout (Haystack Analytics)
- 80% of developers are unhappy in their jobs (Stack Overflow 2024, 65,437 surveyed)
- 65% experienced burnout in the past year (Jellyfish 2024)
The worst part? There's a massive perception gap between engineering managers and executives. According to Jellyfish's 2024 State of Engineering Management Report:
| What's Measured | Engineers Say | Executives Say |
|---|---|---|
| Team is experiencing burnout | 46% | 34% |
| Leadership is "out of the loop" | 43% | - |
| Team has embraced AI tools | 52% | 76% |
As an engineering manager, you're in the middle. Your job is to close this perception gap - to see what's actually happening, not what leadership assumes is happening.
🔥 Our Take
Burnout is a management failure, not a personal weakness.
If your team is burning out, you failed to set boundaries they couldn't set themselves. Individual developers can't say no to unrealistic deadlines - that's your job. Burnout patterns appear in Git data before anyone complains. Managers who see the signals and don't act are complicit.
What EMs Should Track vs VPs and Directors
Different leadership levels need different data. The mistake most EMs make is tracking what their VP tracks, then wondering why it doesn't help them manage day-to-day:
| Level | Focus | Time Horizon |
|---|---|---|
| VP/Director | Cross-team trends, business alignment, headcount planning | Quarterly/yearly |
| Engineering Manager | Team health, delivery flow, individual growth | Weekly/monthly |
| Tech Lead | Code quality, architecture, technical decisions | Daily/weekly |
Your metrics should answer: "Is my team healthy, productive, and improving?" Not: "How do I justify our existence to the CFO?"
The Three Metrics That Actually Matter
Stop tracking 20 metrics. Track three, understand them deeply, and act on what you learn. The fuller set of actionable Git-derived signals - and why each matters - lives in our Git metrics guide. The three below are the subset that hold up best for weekly EM conversations.
1. Cycle Time Breakdown (Not Just Total)
Total cycle time is useless for management. The breakdown tells you where to act:
| Stage | What It Measures | What to Do |
|---|---|---|
| Coding time | First commit to PR open | Check for scope creep, unclear specs |
| Wait for review | PR open to first review | Review SLAs, reviewer availability |
| Review time | First review to approval | PR size, review load distribution |
| Merge time | Approval to merge | CI/CD issues, merge conflicts |
Most teams discover that wait for review is their biggest bottleneck. It's invisible work - PRs sitting in a queue don't send alerts. But each hour waiting is context switching when the author gets back to it.
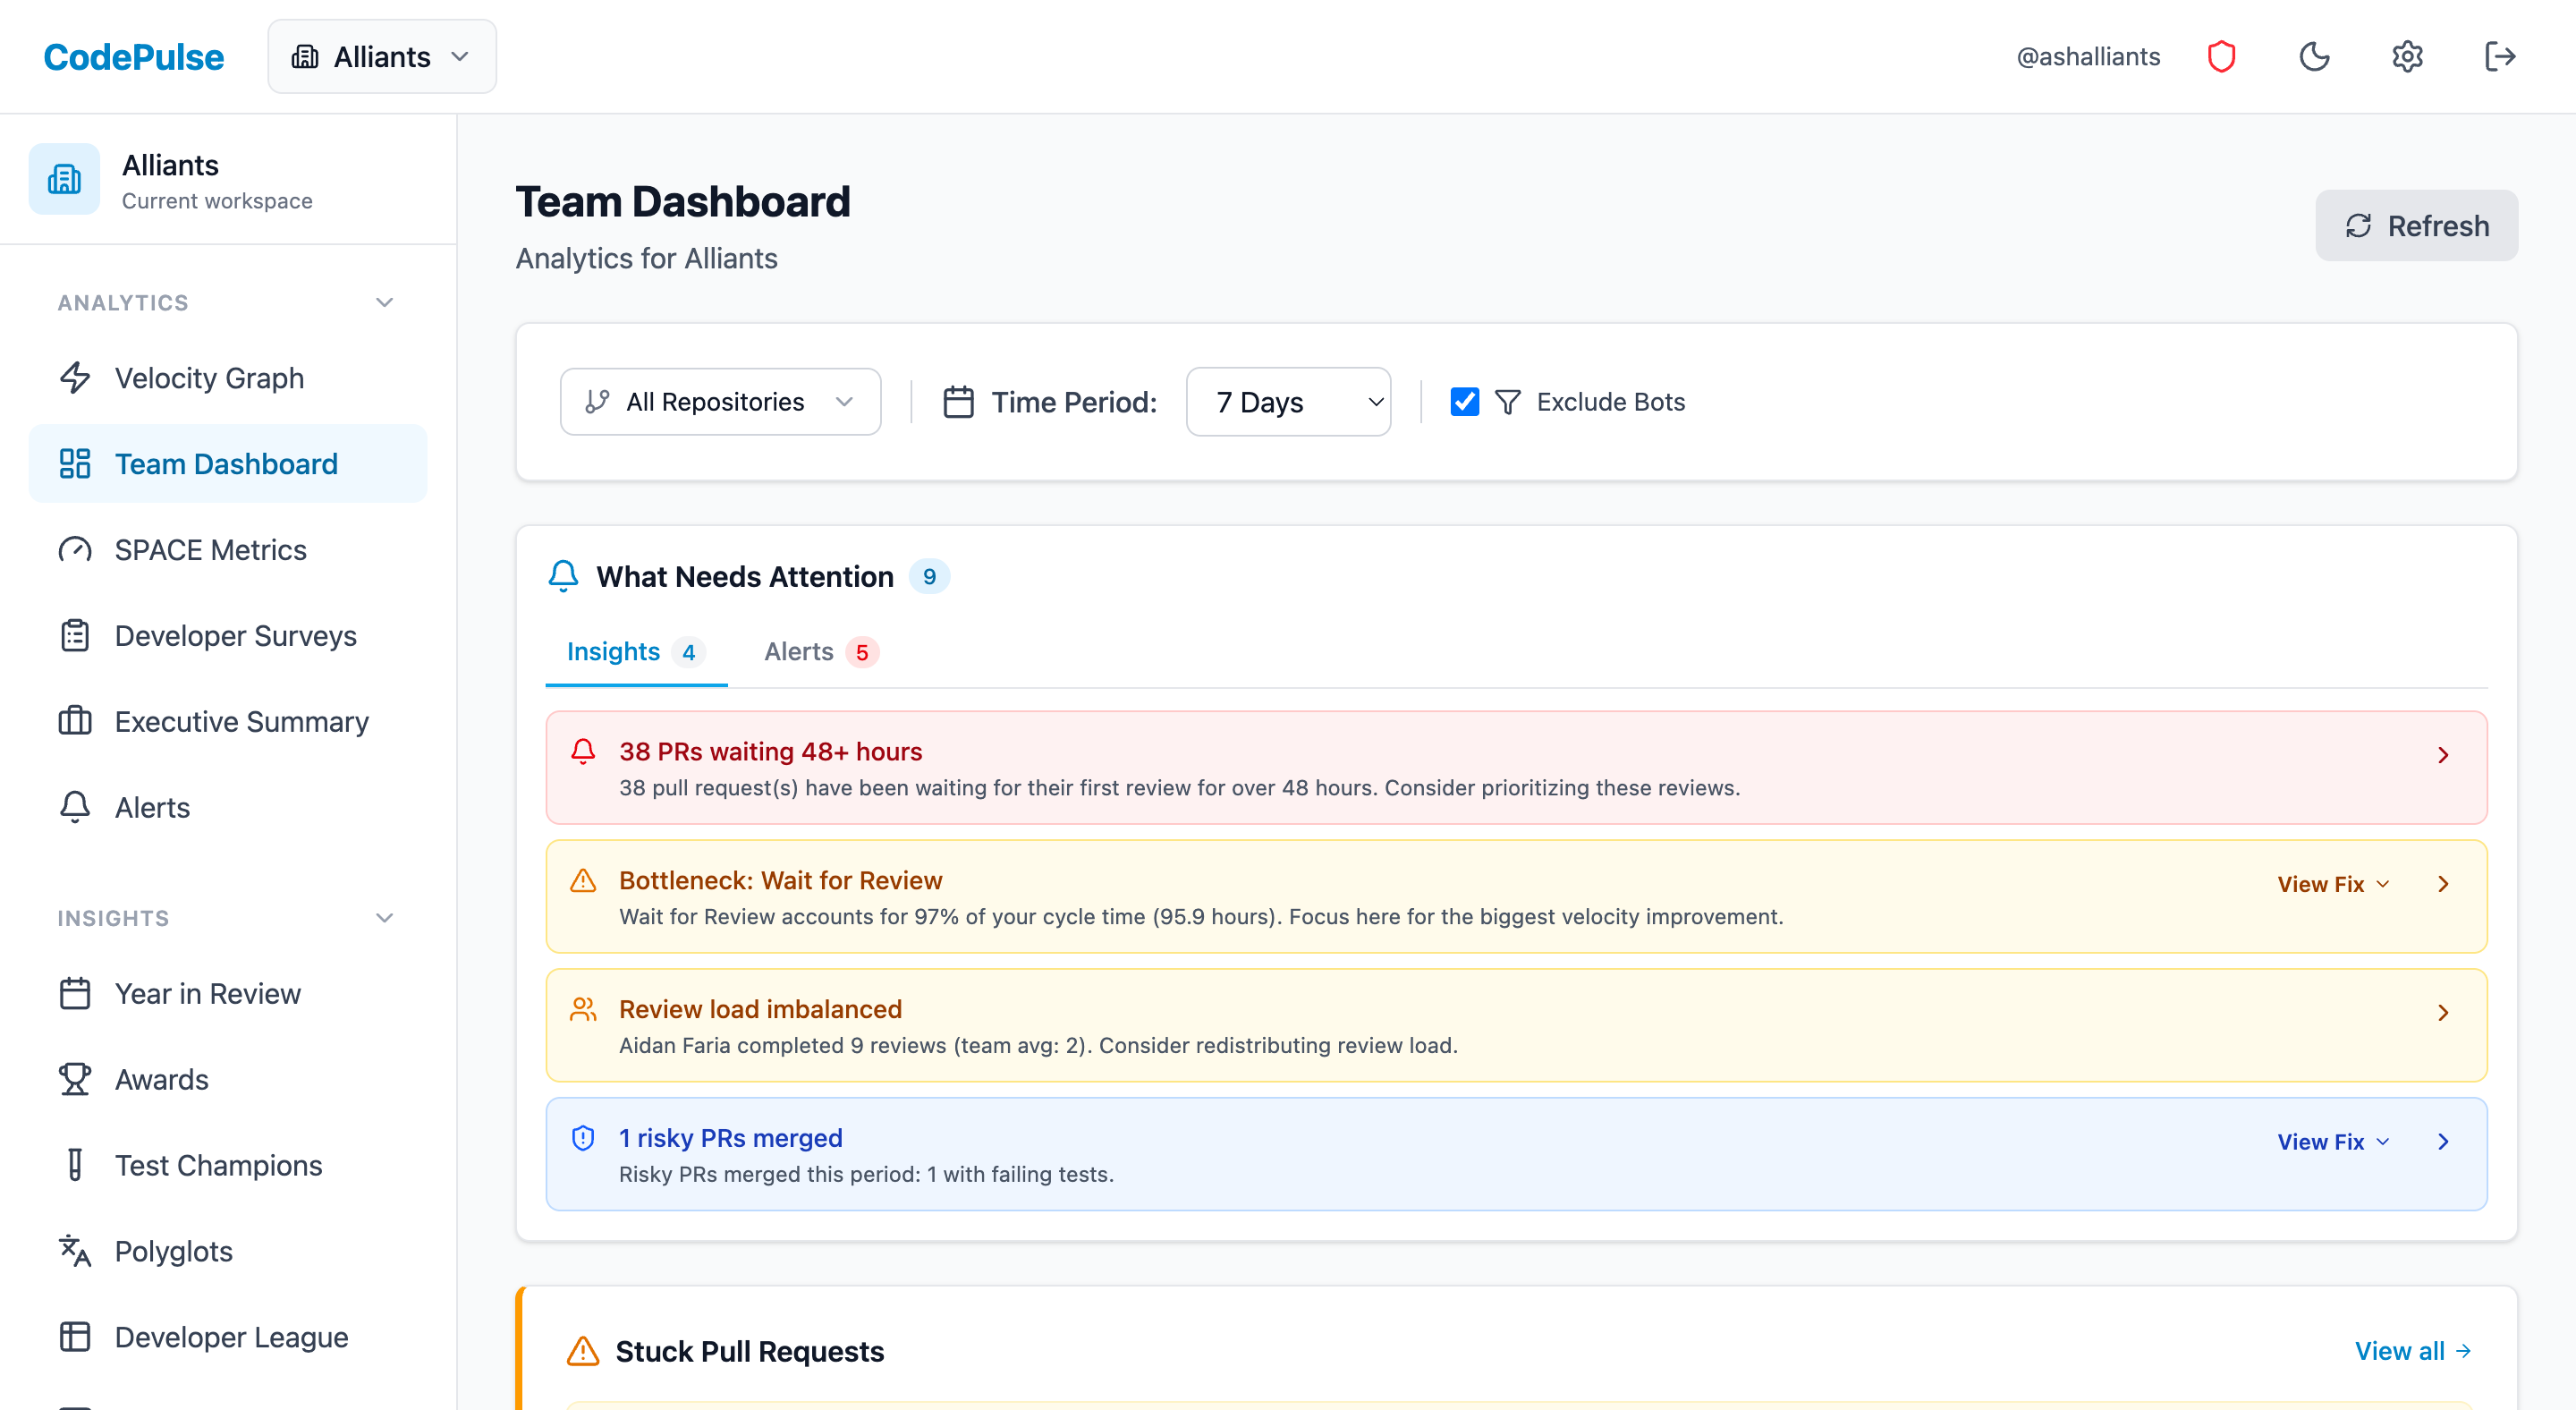
⏱️Viewing Cycle Time Breakdown in CodePulse
The Dashboard shows your cycle time split into these four stages:
- Go to Dashboard
- The cycle time breakdown appears in the metrics section
- Filter by repository to find where bottlenecks differ
- Compare time periods to spot trends
2. Review Load Distribution
Uneven review distribution is the silent killer of engineering teams. When one person does 3x the reviews of anyone else, they're not a hero - they're a single point of failure and a burnout risk.
"Your 'fast' developer is probably just your most overworked. Review overload is invisible work. It doesn't show up in commit stats, so it's easy to miss until someone quits."
Track:
- Reviews per team member per week
- Who's overloaded (doing 3x+ the average)
- Who's under-participating (might need mentoring or pairing)
- Whether the same people always review the "boring" or "scary" PRs
The Review Network visualizes this so you can spot imbalances at a glance.
3. Knowledge Concentration (Bus Factor)
Knowledge silos are team risks, not individual failures. If one person owns all the knowledge about a critical system, you have a management problem - not an engineer problem.
Use File Hotspots to identify:
- Files with single contributors (bus factor = 1)
- Critical paths owned by one person
- Areas that need knowledge transfer before someone takes PTO
- Onboarding targets for new team members
Metrics That Destroy Trust (Stop Using These)
🔥 Our Take
If you're using individual developer metrics for performance reviews, you've already lost.
You'll get exactly what you measure: gamed numbers and eroded trust. The moment you compare Alice's cycle time to Bob's, you've turned teammates into competitors. Metrics are for understanding systems, not judging people. Performance reviews should use metrics as conversation starters, not scorecards.
Lines of Code
The fact that anyone still tracks lines of code in 2025 is embarrassing. In the age of AI coding assistants, it's not just useless - it's counterproductive. A developer who deletes 500 lines while maintaining functionality has done better work than one who adds 500.
Individual Commit Counts
Commit frequency varies by coding style, not productivity. Some excellent engineers make few large commits; others make many small ones. Tracking this rewards a style, not outcomes.
Individual Velocity Comparisons
Comparing individuals creates competition instead of collaboration. Compare team trends over time, not person to person. The goal is team improvement, not a leaderboard.
Activity Without Context
Raw numbers without context mislead. A developer with low PR counts might be:
- Doing complex architecture work that prevents 10 future problems
- Mentoring junior team members (unmeasurable, invaluable)
- Handling production incidents that saved the company money
- On a learning curve with new technology
"The most important engineering work is unmeasurable: architecture decisions that prevented problems, mentorship that made someone better, documentation that saved hours of confusion. If you only track what's countable, you'll undervalue what matters."
Team Health Indicators (Beyond Delivery)
With 83% of developers suffering from burnout and 80% unhappy in their jobs, delivery metrics alone won't catch problems. Track these health indicators:
Work-in-Progress Per Person
High WIP indicates context switching and potential burnout:
| WIP Level | What It Means |
|---|---|
| 1-2 PRs/person | Healthy focus - this is the goal |
| 3-4 PRs/person | Watch for context switching costs |
| 5+ PRs/person | Likely overloaded - investigate immediately |
After-Hours Activity Patterns
Commits and reviews outside business hours can indicate:
- Unrealistic deadlines (management problem)
- Time zone coordination issues (process problem)
- Individual workstyle preference (fine if consistent and chosen)
- Potential burnout (if sustained or increasing)
Don't jump to conclusions on single incidents. Look for patterns over time- increasing after-hours activity week over week is a red flag.
See our Burnout Signals from Git Data guide for the STRAIN score framework.
Review Quality Trends
When reviewers are overloaded or burned out, review quality drops. Watch for:
- Fewer comments per review over time
- Faster approvals (rubber-stamping)
- Same people always doing the reviews others avoid
Your Weekly EM Dashboard (20 Minutes Total)
Monday Check-In (5 minutes)
- Stale PRs: Any PRs sitting >48 hours without review? Unblock them now.
- WIP levels: Anyone with 5+ open PRs? Have a conversation.
- Review queue: Who's waiting? Assign reviewers if needed.
Friday Review (15 minutes)
- Throughput: How many PRs merged this week? Trending up, down, or stable?
- Cycle time breakdown: Any spikes in wait time or review time?
- Review distribution: Who did most reviews? Is it balanced?
- After-hours patterns: Any concerning trends?
Monthly Deep Dive (30 minutes)
- Trends: Is cycle time trending up or down month-over-month?
- Quality indicators: Test failure rates, review coverage
- Knowledge silos: Any new high-risk files or growing concentrations?
- Team health: Cross-reference with 1:1 feedback. Do the numbers match what you're hearing?
Using Metrics in 1:1s (Without Destroying Trust)
Metrics should inform coaching conversations, not replace them. The data is a conversation starter - not a judgment.
Do This
- "I noticed your cycle time increased last week - what's going on? Anything blocking you?"
- "You've been doing a lot of reviews lately - how's your bandwidth? Do we need to redistribute?"
- "The team's PR sizes have been creeping up - any ideas why? Are specs unclear?"
- "I see you're the only one touching the auth module - should we get someone else up to speed?"
Never Do This
- "Your commit count is lower than Sarah's"
- "You need to improve your cycle time by 20%"
- "I'm tracking your LOC output"
- "The dashboard shows you're less productive than the team average"
The difference: good usage asks "what's happening?" Bad usage passes judgment.
Common Scenarios and What to Do
"My team seems slow but I can't pinpoint why"
Check: Cycle time breakdown
- Long coding time → unclear specs, scope creep, or complex area of code
- Long wait for review → not enough reviewers, unclear ownership, or overloaded reviewers
- Long review time → PRs too large, complex changes, or reviewers lacking context
- Long merge time → CI/CD issues, flaky tests, or deployment bottlenecks
"One person is always the bottleneck"
Check: Review Network and Knowledge Silos
- Are they the only expert in an area? → Prioritize knowledge transfer
- Are they over-assigned as reviewer? → Redistribute ownership explicitly
- Are they overloaded with their own work? → Reduce scope or get help
"Team morale seems low but delivery is fine"
Check: Hidden strain indicators
- After-hours commits trending up?
- WIP per person increasing?
- Review quality declining (fewer comments, faster approvals)?
- Same people always doing the "boring" or "risky" work?
Remember: 46% of engineers report burnout while only 34% of executives see it. The gap exists because delivery metrics hide team strain.
Setting Up EM Alerts
Use Alert Rules to catch issues early. Don't check dashboards constantly - let the alerts come to you:
| Alert | Threshold | Why |
|---|---|---|
| Stale PR | >48 hours without review | Keep flow moving, prevent context loss |
| Large PR | >500 lines changed | Review quality suffers on large PRs |
| Cycle time spike | >2x weekly average | Catch problems early |
| Review imbalance | One person >3x team average | Prevent burnout and single points of failure |
🔔Configuring Alerts in CodePulse
Set up alerts to surface issues automatically:
- Go to Alert Rules
- Create rules for cycle time, PR size, and stale PRs
- Choose notification channels (email, Slack)
- Start with loose thresholds and tighten as you learn your team's patterns
Getting Started: The First 30 Days
Week 1: Observe
Connect CodePulse to your GitHub org and review baseline metrics. Don't share anything yet - just observe. Look for:
- Where time goes in the cycle time breakdown
- Who's doing most of the reviews
- Which files or repos have the longest cycle times
- Any obvious knowledge silos
Week 2: Identify One Issue
Pick one obvious issue from the data. Long review wait times are common and easy to address. Discuss with the team without blame:
"I noticed PRs are waiting an average of 18 hours for first review. Any ideas on what's causing that? Is it workload, unclear ownership, or something else?"
Week 3: Set Up Alerts
Configure alerts for the issues you identified. Let the team know what you're tracking and why:
"I've set up alerts for PRs waiting more than 48 hours. This isn't about surveillance - it's about making sure no one's work gets stuck. If you get an alert, it's a prompt to help, not a criticism."
Week 4+: Make It Routine
Build metrics into your weekly rhythm:
EM Weekly Metrics Checklist:

MONDAY (5 min)
☐ Check for any PRs stuck >48 hours
☐ Review alert notifications from past week
☐ Note any unusual patterns to discuss

TEAM STANDUP/SYNC (2 min)
☐ Highlight one positive trend ("cycle time down 15%!")
☐ Call out one area to watch ("review wait times creeping up")
☐ Keep it brief - data informs, doesn't dominate

1:1s (as conversation starters)
☐ "I noticed you've been doing a lot of reviews - how's the load?"
☐ "Your PR sizes have been really clean - what's working?"
☐ "Seeing some late commits - everything okay?"

END OF WEEK (5 min)
☐ Note any patterns to bring to leadership
☐ Identify one thing to improve next week
☐ Recognize someone who helped the team
Free Download: EM Weekly Metrics Checklist (Interactive) | PDF - A fillable template with space for tracking velocity, quality, and team health metrics.
- Share interesting patterns (anonymized) in team meetings
- Celebrate improvements publicly
- Use data in 1:1s as conversation starters
- Adjust thresholds based on what you learn
"The goal is visibility that helps your team, not surveillance that erodes trust. If your team feels watched, you're doing it wrong."
Going Deeper
This guide covers the essentials. For specific topics, see:
- Detecting Burnout Signals from Git Data - The STRAIN score framework for early warning
- Measuring Team Performance Without Micromanaging - Building trust while maintaining visibility
- Review Load Balancing - Distributing review work fairly
- Cycle Time Breakdown - Deep dive into the four stages
See these insights for your team
CodePulse connects to your GitHub and shows you actionable engineering metrics in minutes. No complex setup required.
Free tier available. No credit card required.
See These Features in Action
Board-ready engineering performance in a single page.
Break down cycle time into coding, waiting, review, and merge phases.
Interactive graph of review relationships and workload distribution.
Related Guides
Engineering Metrics That Won't Get You Reported to HR
An opinionated guide to implementing engineering metrics that build trust. Includes the Visibility Bias Framework, practical do/don't guidance, and a 30-day action plan.
Your Git Data Predicts Burnout 6 Weeks in Advance
Use the STRAIN Score framework to detect developer burnout from Git data. Identify after-hours patterns, review overload, and intensity creep before they cause turnover.
Your Best Engineer Is About to Quit (Check Review Load)
Learn how to identify overloaded reviewers, distribute review work equitably, and maintain review quality without burning out your senior engineers.
The 4-Minute Diagnosis That Reveals Why Your PRs Are Stuck
Learn to diagnose exactly where your PRs are getting stuck by understanding the 4 components of cycle time and how to improve each one.
Quantitative Developer Experience Data: Measure DevEx Without Surveys
Move beyond surveys to measure developer experience with behavioral data. Learn the 7 quantitative DevEx metrics you can track automatically from git.
Engineering Operations: Running a Software Org Like a Business
Engineering ops is the operational discipline connecting your delivery pipeline to business outcomes. The system-level approach to cost per feature, capacity, and predictability.